Stock Market Signposts with Stakes & Measuring Rods
At this stage of a pullback in the Stock Market it is time to bring out the Stakes in the Ground and Measuring Rods to identify the Game Plan. That way one is not surprised should it turn into a full blown correction, given the first signs of real weakness we have seen the last few days.
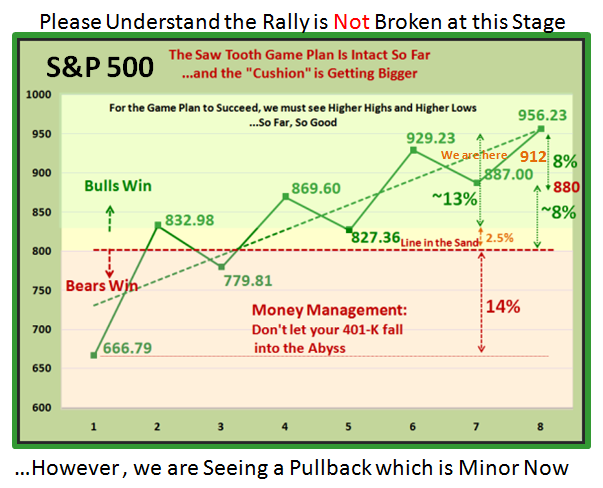
You have seen the Saw Tooth Game Plan many times, so it needs no introduction. We have a 16% cushion, and 8% down will take us down to 880. We are over half way there at 912, so it is time to sit up and plan ahead as to what action you will take if we fall further:
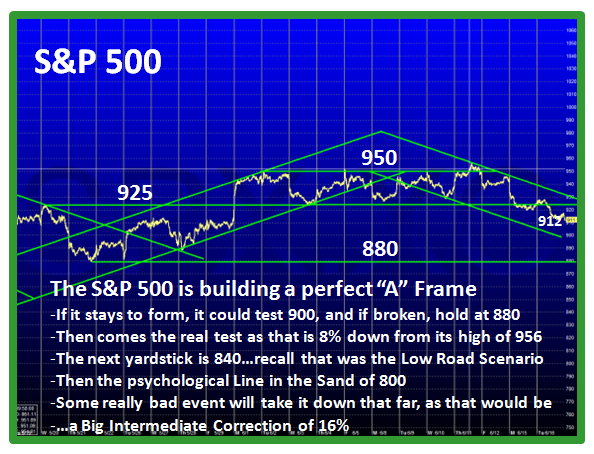
The S&P 500 hit 956 at the high and decided that was enough for now and finished today at 912 so we are 4.6% down from the high. Heading down to 880 would kill several birds with one stone:
1. Drop <8% down where 77% of Minor Corrections are halted
2. Start the next leg of this rally after a pause to refresh at that level
3. Breakdown into an Intermediate Correction of 12% to 16%
4. Test the areas of support at 840 which you will recall was the Low Road
5. Head down further to test the psychological Line in the Sand at 800
Types 1 & 2 will quickly turn from being long to turning to the short side;Type 3’s will be patient and wait for sunnier climes; Type 4’s will review the extent of the damage and if the Golden Cross of the 50-dma up through the 200-dma materializes for the S&P 500, Dow and NYSE, they will scratch their heads as to whether it is then time for them to enter. The Nasdaq and NDX (Nasdaq 100) should already be above whether it is measured with Simple or Exponential Moving Averages…whichever tickles your fancy.
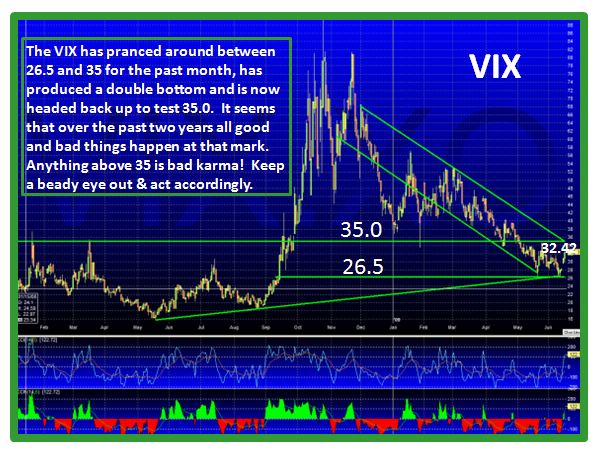
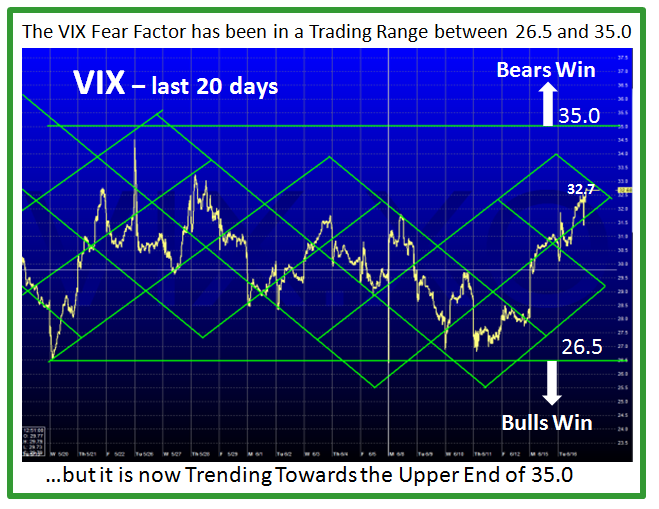
Another way of assessing the extent of the potential damage is to turn to the Fear Factor of the VIX which has been relatively benign this past month. However, after seemingly wanting to head down below 26.5 three days ago it turned turtle and has shot up to 32.7 as shown in the chart below:
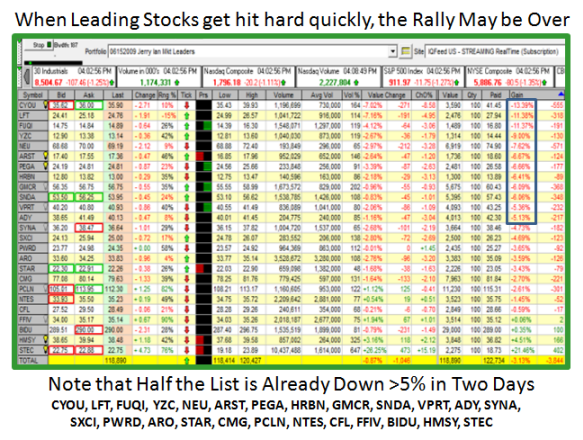
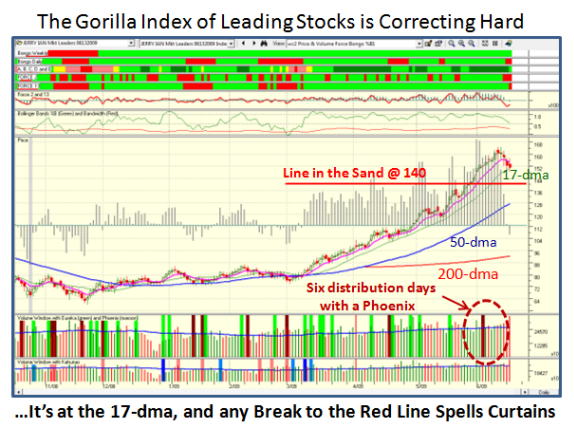
Don’t stop there, but use a third approach to see if the underlying strength of the Leading Gorilla Stocks are holding up or giving up the ghost. The last two days have been ugly, but that is the whole purpose of using these as a yardstick for early warning of good or bad things to come, since they are fat with profits. My good friend Jerry Samet sent me his list of top stocks and I rounded it up to give us 25 in total…most of which I have shown you in recent blog notes. Note half of them got walloped today, which should not be taken lightly.
It’s always “Your Call”. Best Regards, Ian.
 Ian Woodward's Investing Blog