Ian Woodward's Investing Blog

Archive for the ‘Market Analysis’ Category

The Value of Eureka Signals at Market Bottoms

Thursday, August 7th, 2008

Eureka

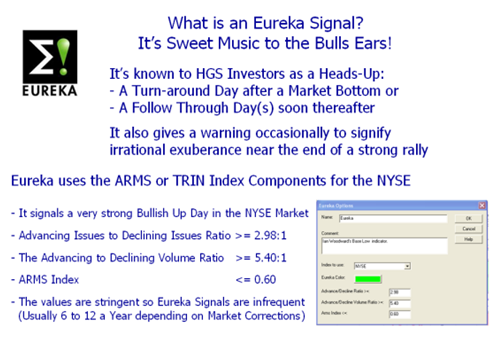
At this important juncture, I felt I should post this note in its entirety without any editing.  If it is too much to digest just move on, but I feel it is a good educational follow-up to the thread of posts relating to Follow Through Days (FTD) and a perspective of the pulse of the current market.

Mailbag Discussion:  

I have spent some time studying. I like you have been waiting for a Eureka and confirmation with new 52-week highs. I created some new views on High Growth Stock Investor to help me go back in time. I looked at the Coppock, Eureka, NYSE new Highs and Lows as well as a follow-through day visual filter back test. I made up a daily Coppock that mimics the Weekly Coppock using 50 and 70 days and 50 day average. It tracks the weekly quite well.

I went back to 2003 in a NYSE daily chart and studied what I saw comparing to current time. In 2003 we did not get a Eureka until 30 trading days after the 17 March 2003 FTD, the Eureka came in late April. The NASDAQ followed through on 3/17, the NYSE did not as it was just day 3 on the NYSE. The NYSE 52 week new highs did not broach 100 for 12 days after the NASDAQ FTD and then it dallied for a couple of weeks before really taking off.

What I see now in the market looks a whole lot like the 2003 time frame (different stocks and groups breaking out). I also think that it is quite impossible to have a Eureka when the market is in a big rotation as we have now and as we had in March of 2003. I think the Eureka works well for follow-on rallies but when we are in a major rotation it may not work. Think about it. The Eureka requires a large ratio of new advancers to decliners. When the decliners are so huge like the oil base stocks tanking it is quite a high threshold to expect that advancers could overcome this downwash. It took 30 trading days for the market to confirm the rally in 2003 because of this.  Mike Scott

Response:  Mike:  You are absolutely right that one’s expectations for a Eureka should not be within the normal 12 to 15 days of a Capitulation, given the parallel to 2003, but there are at least a few other factors that must come into play on the positive side while the tide is out that we should like to see shaping the internals:

1. As I said on my blog the first expectation must be that the New Lows go dormant. I note that over the course of 21 days after the Temporary Base Low, one should expect this number to average about 40, with less than a handful of days at above 50 during that period.  Over the past 14 days that number is at 64, so it is not dormant yet, and we have not had a single number below 42 to date, using HGSI data.

2. The second yardstick relates to the components of the Eureka.  I buy your argument that New Highs and Advancing Issues to Declining Issues cannot be expected to rise from the ashes in so short a time given the rotation and Oil stocks being a big part of the clobbering.  However, on that which is moving I certainly expect that there be some more enthusiasm in the beaten down stuff they are now buying to the extent that the Advancing Volume to Declining Volume should show some perkiness.  Furthermore, back in 2003, the ARMS ratio itself kept dropping below 0.60 at least ten times and the Adv Vol: Dec Vol was up at least 6 of those occasions to above the 5.40:1 requirement while waiting for a Eureka.  In effect, we had six 2/3rds. of a Eureka! That tells me that there is insufficient buying pressure with conviction on the NEW Groups to which the herd is rotating into, since we have not had a single reading on either of them making the yardsticks.  The inference is that we are so badly trounced that either there is insufficient conviction or we have still a ways to go before we see more enthusiasm.  The bottom line is that we are still stuck in the mud.  Even the Biotech’s got clobbered today.

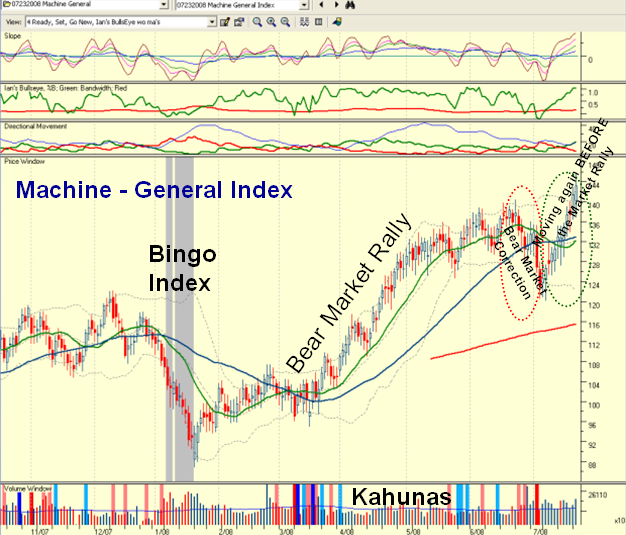
3. Let’s not forget the simplest and most reliable of requirements which are that the 50-dma must be flat, and the 4-dma, 9-dma and 17-dma must all come up through it at the 405 Freeway mark. The 50-dma is not flat at the moment, to say nothing of the 200-dma which is pointing down. Both items appear to be at least a week off for either the Nasdaq, or more so the NYSE at this time…though all our past history on this particular item has been on the Nasdaq.

4.  Sadly, on this occasion just like 2003, we have the black cross of the 50-dma below the 200-dma, so the expectations of the ceiling is at that very point of any rally before it peters out, if it even gets there.

5. The bigger question is whether we are truly at early 2003 or one stage removed from there at October 2002.  In which case we had plenty of Eurekas in that phase, but what is missing so far are the leaps and bounds of Price Gains that propelled the Nasdaq out of the basement back then.  In my blog I mentioned that we need some catalyst to cause this to happen.  Back in 2002 and 2003, everyone had thrown in the towel and more importantly had done so over three years, not less than one.  Somehow, I don’t feel the swamp is fully drained yet, nor is there the irrational exuberance to really come into the market with a vengeance, which is usually signaled by Eurekas.

6. What is more important is the extent of the Bingo count this time which is similar to back then, so it suggests at least we are seeing some signs of throwing in the towel, even though the VIX is relatively quiet.

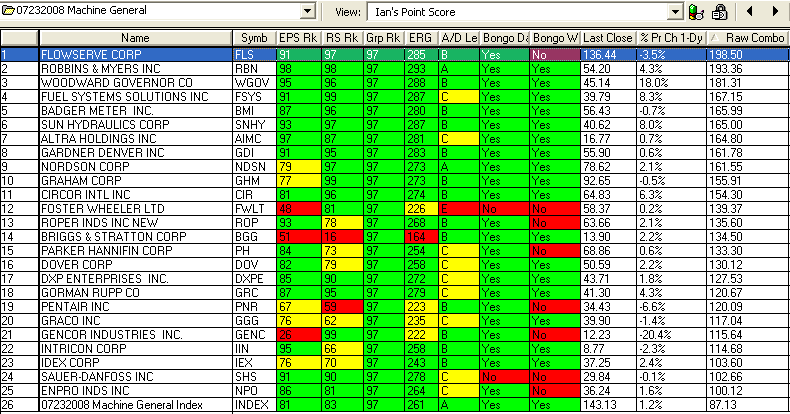
7. If Industry Groups don’t show signs of improving towards the A and B column in a hurry, this attempted rally is little more than mostly bottom fishing and identifying some potential leaders for the next round trying to repair their bent up chart patterns into decent shapes.  We can take some comfort that the number of A’s have improved from 5 to 19 with the last two FTD’s and from 56 to 74 on the B’s.  That means we have a 60:40 split between the former and the C to E Groups, since as you know we have a count of 154 Groups.  I am sure today’s action will kill some of this again.

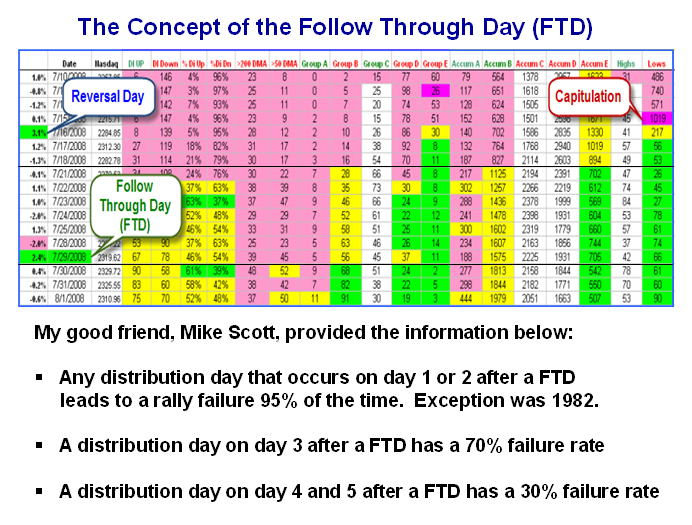
8. Now I know all the stock market forums are anxious to know whether FTD’s are enough of a signal to go by and we have both proved that it is no better than a toss of the coin, so it was comforting to see the second punch at it yesterday where at least the Nasdaq is showing a lot better response than the DOW, the S&P500 or the NYSE.  However, it seems to be two steps forward and one or two steps back, which does not allow for even holding overnight, leave alone a few days to weeks.  When one has three black crows without five white soldiers any rally is suspect.

9. It appears to me that Type 1 and 2 traders are the only people who can make money provided they are nimble, turn on a dime, and essentially moment or day trade.  Type 3 and 4 longer term investors are not going to miss a thing given what we have seen these past two weeks.

The bottom line is that it takes more than a couple of Eurekas to confirm a decent rally and if I left you with that impression then I feel sure I may have done so for most of my readers who are not so well versed with the dynamics as you are.  In which case, I would like to use your note to me and this response as a teaching tool on my blog by way of educating them and perhaps your readers that life is not that simple in Bear Markets.

Best regards, Ian.

The Wall of Worry Meter on Wall Street

Tuesday, August 5th, 2008

Mailbag Question:  Ian, This may be a real stupid question but here goes … being in such a volatile and highly out of the norm type market that we have seen in the past 10 months or so ( Bear or not ) … and being that we look for the NH’s ( over 125 – 150 ) to greatly outnumber the NL’s  in the ratio for start of the leg up … how can we realistically look at the Hi/Lo ratio now when they have been so overwhelmingly skewed to the Low side by such drastic numbers? With so many stocks ( and groups ) slaughtered to their low side … by the time any type of NH’s to appear in large numbers we may be so far into the recovery or next leg up that we miss the beginning.  Am I missing something here or maybe this one technical aspect not be as valid now as if we were in a semi-normal market ( again considering how absolutely and utterly whacked this market has gotten to the downside).This is just something that has been bugging me for some time as I look at the daily Hi/Lo ratio staying at such a DOWN situation for so long.  Yours, Steve 

               meter   

Answer:  Hi Steve, that is not a stupid question, as the last time we were stuck in a rut like this was in 2000 through 2002. The New Highs took a long time to come to the surface, since everything was cleaned out, and new Leadership had to regroup.  As we know there were still several decent bear market rallies during that time.  I tried to answer the mood of the market in my note on the blog, but the subject matter was essentially whether we had a legitimate Follow Through Day (FTD), and the caution that we might be headed for yet another disappointment and a failed rally:

  1. >>>”When a Market is so oversold as this one is, the tide goes out so far that most boats are still stuck in the mud, and it sometimes takes a pull back and a second effort to take off on a rally…that is why 50% of the Follow Through Days (FTD’s) fail on the first attempt and then move up on the second shot.  (Editor’s Note: It looks like we got it just in time!  A second follow through day with oomph.)  
  2. This is especially true in a Bear Market. It needs a one-two punch from the Bulls to drive it up, while at this stage of the game the Bears only need one punch from here to drive it down.  Net-net, the Bears have the upper hand after two weeks of trying by the Bulls.”<<<
  3. The net of all of that is that the Market is so oversold, and the rally so far classed as “Failed” in my eyes, especially after yesterday’s distribution day on a couple of the major Market Indexes.  The odds are that we should expect at least a retest of the lows before we will either see it hold for a double bottom or breakdown further.
  4. I will grant you that we should not put too much emphasis on the New Highs vs New Lows parameter, but at least I want to see New Lows stay DORMANT.  By that I mean that they have to stay below 30 (say) for a while to show that we have completely bottomed…and what do we have today (Monday) if I trot over to the WSJ Page? We got 32 New Highs and 124 New Lows on the NYSE…not good.  But let me accept your point for a moment and forget the New Highs showing some spark of life, since you make a very reasonable point.  At least you will give me the logic that New Lows had better stay dormant for starters, otherwise we have not truly bottomed.  But let’s look for other clues:


The Downside Gloom and Doom

  1. You will agree that for there to be any signs of real buying enthusiasm we must see irrational exuberance as expressed by Eurekas…not one my buddy on the NYSE. 
  2. In addition to that we need to see some Kahunas to show signs of excitement.  We got a couple of Little Kahunas on 7/29 and 7/30 on the NYSE, but then it was followed by one to the downside and three black crows for candlesticks. Where are the five white soldiers?  No cigar.
  3. I am a biggie on the McClellan Oscillator and more importantly the Summation Index.  We have not been this low since the Oct 1998 Asian Contagion, after which it took off like a rocket when the Banks banded together to solve the Japanese Financial run on the Yen, if my memory serves me correctly.  The message is it took a Catalyst of some good news to propel the market with vigor back then.  We are lower this time around, with a reading of -2874 on July 16th, when the previous low during all the kafuffle from 2000 to 2003 was no lower than -2218 on July 26, 2002.  On that occasion there was a bounce for seven weeks to 1294, only to fall back again for a month before it finally took off for a three month rally.  We have currently cut the -2605 by half to -1390, but no where near positive territory as yet…again implying there is no enthusiasm from the Bulls, leave alone irrational exuberance.osc

    4.  Staying with the internals, the next thing to turn our attention to is the extent of the Accumulation versus Distribution in both the Industry Groups and the Stocks themselves, and this was the central focus I provided in my note on the blog.  With that stake in the ground, we know that the %E’s hit the lowest ever recorded of over 34% a few weeks back as I showed in the newsletter.  I have also proved that if the %E’s are greater than 17% when a rally attempt is launched, we will invariably get a failed rally on the FIRST attempt from such depths.  That is precisely what has happened so far.

    a and e

    5. If we go by yesterday’s action all the old favorite commodity wolf packs are being trashed so that game is over for now.  We then look for rotation and where do we see it…Health Care, a bounce in beaten down Financials, a bounce in beaten down Home Builders, precious little in Technology (until today).  So yes there is money to be made in beaten down stuff but there is no beef.  The bottom line is that there is NO real Leadership right now.

    6.  Throw in the slowing down of Global markets, with Europe feeling the pinch of a Recession, Japan never getting off the mat at all, and so on and so forth.

    7. At times like these, one CANNOT separate the overall mood of the public from what spills over into all the talking heads discussions the various airways provide.  The net bottom line is that the every day John and Jane Doe are fed up to the hind teeth with the increasing cost of living, and all the “fru-frau” about Oil.   That, on top of the fact that the “Do Nothing Congress” has decided to go on vacation for five weeks and in effect run out the clock on what is the hot topic at every water cooler conversation and that is “To drill or not to drill…that is the question?”  Net-net, throw all the bums out, and John and Jane Doe have learned now is not the time to be “playing the stock market”.

    The Upside Hope for Sunshine

    So much for the downside; what about the upside?  I return to my Wall of Worry Meter on Wall Street.  There is the old cliché:  “The Market Climbs a Wall of Fear”.  We are now at the stage where this market needs a Catalyst; it’s as simple as that.  At a time like this when there are so many cross-currents, it is hard to narrow it down to one item, but I will offer three to perhaps give us a Summer Rally:

    1. Oil down below $100 will stop the hubbub at the water cooler; just as I gave you the XLF at a critical juncture to watch a few weeks back, watch USO.  We need to see it break down below 96 and fill the gap down between 95 and 94; and then make its way down to seek at least a low of 90.

    2. Oddly enough I feel the Olympics could be a Catalyst as China becomes front and center for the next two weeks.  You can rest assured there are background talks going on to reverse Wall Street’s downward slide that triggered a 40% sell-off in China Silverback Stocks, keep U.S. consumers buying China goods, and keep $1 trillion in U.S. dollar-based investments from free falling into an abyss, which in turn could rock the Chinese economy for years to come.

    3. Continued calming of the Financial Markets with easing of the credit crunch and keeping inflation in check, with no further easing or tightening at this juncture by the FED.  Net-net, we need a continued rise in the U.S. Dollar.

    Let’s hope one or all of these kick in before too long and we have some respite from the brutal weeks we have had. 

    Editor’s Note!  This was written last evening and e-mailed first thing this morning, and one never can tell with this tricky market.  Maybe we have seen a turn-around from all the gloom and doom and have finally got a big day upwards to compensate for all the woes of the past week.   This would be the one-two punch I was waiting for.   We might even have a Eureka signal after tonight’s download to cap it off!

    Best regards, Ian.

The Follow Through Day (FTD)

Saturday, August 2nd, 2008

Mailbag Question: Dear Scottish John, not only haven’t we run out of time for #2 but hasn’t Mr. Market failed to fulfill most of those clues?  Therefore, shouldn’t we “Otherwise consider anything less as a Bounce Play and expect a retest of the lows.” Regards and much thanks, dave (If you didn’t know it, Ian is Scots for John.)

        races

  • Please refresh your memory with the targets I set for the Bear Market rally to be more than a Bounce Play in an earlier blog with the same picture written on July 19, three blog notes back…which Dave is referring to. 

Hi Dave:  Move to the head of the class, your beady eyes have seen that SO FAR this is nothing but a Bounce Play and a failed Rally, and therefore as of right now the key sentence you plucked from my note is where the odds stand as of today, and the full answer should come next week; so your note is very timely.  Always have three current scenarios: 

  1. The Market goes down to retest the lows and the Bears are in command
  2. The Market hovers around sideways and then either goes up or down
  3. The Market is still oversold and the Bulls feel it is time to try again, since the Bears have not collared this by the scruff of the neck this past week. 
  • My point is nothing is ever cut and dried. Next week should tell us which way the wind is truly blowing, although it points to #1.  The reason I hesitate is that the INTERNALS of the market relating to Accumulation/Distribution have improved both for the Industry Groups and the Stocks themselves since July 19.
  • When a Market is so oversold as this one is, the tide goes out so far that most boats are still stuck in the mud, and it sometimes takes a pull back and a second effort to take off on a rally…that is why 50% of the Follow Through Days (FTD’s) fail on the first attempt and then move up on the second shot.
  • This is especially true in a Bear Market. It needs a one-two punch from the Bulls to drive it up, while at this stage of the game the Bears only need one punch from here to drive it down.  Net-net, the Bears have the upper hand after two weeks of trying by the Bulls. 
  • That should give you enough to chew on for an immediate response, but I will give you more in a blog I will put up over the weekend, which will show you the good stuff “Under the Hood” that makes me hesitate to say the “Party is Over”, period.  Since this note is buried in the comments section, I will resurrect it in its entirety to full view and repeat all this and add more in a fresh blog.  As promised, here is the picture of the good stuff “Under the Hood”.  Let me first set the context in which this picture gives a perspective of where we are regarding a successful or failed Bear Market Rally.  This coming week should determine the outcome.chart                         
  •  

The Color picture shows very well the phases of red, yellow and green in the Industry Group and Stock Distribution turning to Accumulation as depicted by the Columns showing Group A to E, and Stocks with Accumulation from A to E. 

  1. The cycle starts when the market has peaked and we begin the downward slide, depicted by Bingo signals showing the RSI (14 periods) dipping further and further down below a reading of 30 on the NYSE.
  2. Ultimately, the Market will find a bottom, and this is usually signaled by a final Bingo which is called the Capitulation Day in which the number of New NYSE Lows give a major spike from previous readings. 
  3.  In this case the number of New Lows shown is the number of stocks in the HGSI Software Database, but to all intents and purposes you can see that the number of 1019 is almost double that than the previous day and it falls off dramatically the day after that.  One can’t help but notice the spike, and that is the first sign that the Bulls have thrown in the towel when it is a day of fear, and the VIX rises dramatically, usually spiking to a high.
  4. Invariably, the day’s Low will be a long spike down (a Tail) on the candlestick with the Market Close finishing much higher as the market decides to rebound.
  5. If there is a true rebound then this Capitulation is quickly followed by a huge Reversal Day where the Nasdaq will deliver at least a 2.2% up day in Price gain, and in this case it was 3.1%, as shown on the above spreadsheet.
  6. Once we have a Reversal Day, the next item to look for is a Eureka Signal which shows the Bulls are in earnest and demonstrate “irrational exuberance” by clocking up at least 3:1 advances versus declines, 5.4:1 in Adv Vol to Dec Vol, and an ARMS reading of <0.6 on the NYSE, which as we all know is very bullish.
  7. These Eureka signals invariably appear within 12 days of the Reversal Day and there are at least two or three of them for good measure. 
  8. Meanwhile, we also keep a beady eye out for what has become known as the Follow Through Day (FTD), where the Nasdaq again delivers a strong up day both in Price and Volume.
  9. My work has shown that the “odds” of a FTD being successful is no more than 50%, i.e., a toss of the coin, and this is especially true in a Bear Market.
  10. As I show above, any distribution day that occurs within 5 days after an FTD diminishes the probability of a successful follow through day.  My thanks to Mike Scott for this information.
  11. After day five following an FTD, the probability of success increases if there has been no distribution and as the picture shows, we will not have reached that state until Tuesday of next week.
  12. The final and most important requirement for a successful FTD is the need for the NYSE New Highs to get above 100 and then stay above 150 while the New Lows diminish to less than 50 (say). 

Nothing in the Stock Market repeats itself consistently, but these are rules of thumb that over the past eight years have proven fairly reliable.   I have given you a step by step recital of the process and shown you a picture to help you along.  It is not that complicated as the net-net message comes down to a few basic points: 

  1. After a Capitulation Day expect a Reversal Day, and then a Follow Through Day within three to nine days. 
  2. Once you have a FTD, there should be no distribution days for five days thereafter.
  3. Eureka signals should register within 15 days of a Capitulation Day and if not the rally must be regarded as suspect.  New Highs on the NYSE must exceed 100 to 150 while New Lows go down rapidly to less than about 50.    

If any of these rules are violated it is probably a failed rally, and little more than a Bounce Play that will invariably end in a retest of the recent low to provide a double bottom or worse yet searching for a lower bottom.  As my friend Dave reminds me a strong clue that all is not well, particularly at this time of earnings reports, is when stocks deliver strong gains but there are failed breakouts galore or the stellar results are ignored and the stocks are pummeled.  The worst clobbering occurs when the results are reasonable but the guidance for the following quarter and/or year is lowered.


Best Regards, Ian.


Falling Crude Lifts the Mood; Beware of the Crosscurrents

Wednesday, July 30th, 2008

batman         

                                   batman 2 

 I couldn’t resist a tongue-in-cheek analogy to the hot topic around the country on this gasoline affair, and I am sure it will all eventually sort itself out, but not before the hubbub on the Price of Gas comes back down below $4.00 and a Barrel of Crude Oil dips below $100, and/or T. Boone Pickens Wind Plan comes to fruition, etc. etc.  Unfortunately, it is no laughing matter but the question is how do we as Investors and Traders deal with it?  The Market is telling us what to do:

Investors:  Stay in your foxhole and/or not only bottom fish, but dredge in beaten down Industry Groups that are showing signs of moving.  

  1. These include the recent hot Wolf Packs of the Solars, Steels, Fertilizers, Coal, Machine General, Railroads, and Energy Drilling…mostly hot today, but you must turn to trading these.  Coal is white hot today as are the Steels!
  2. Alternatively, you buy the Home Builders and Financials and pray you dredged correctly.  Today the Home Builders are getting whacked.
  3. Yet again, you can fiddle around with the Health Care Sector, and an occasional good Tech stock.
  4. Be aware that the small caps are outpacing the mid caps which in turn are doing better than the large caps…unless you are buying JIRM stocks. 
  5. But don’t say I didn’t warn you that Cash is King at the moment, unless you have it in a failing Bank!  Then, stuff it under the Mattress, even if it gets lumpy.
  6. Wait for a Eureka signal, and the New Highs at least >100, and then stay up there to average around 150.  This last point is EXTREMELY important, and I will show you why at the next Seminar in October.  Hurry, we have eight seats left. 

Traders:   

  1. Have your hot Wolf Packs at the ready as mentioned above, and trade the Flavor of the Day.  Add the JIRM Stocks to your Wolf Packs as shown below.
  2. What’s up today is down tomorrow so be prepared to turn on a dime and you must be nimble, take what the market will give you, have tight stops and stay glued to your screen. 
  3. If you have confidence in us and/or know your onions, then concentrate on the JIRM >$35 and JIRM <$35 for your best picks, given to you all of four months ago, and are still as good as ever considering the hammering the Market has taken:

 jirm       Late Breaking News:  First Solar reported earnings after the bell and it is flying high.  There’s your winky winky for tomorrow.  Watch the Solar Wolf Pack first thing tomorrow.  jirm 2       Best Regards, Ian.  �

A Case Study of the Machine-General Index and RBN

Wednesday, July 23rd, 2008

Mail-Bag Question: Ian, RBN is doing extremely well in this correction. Since it’s now extended what would you need to see in order to consider it a safe buy? Best Regards, Paul

rbn

Paul:  There is no “safe” time in this market.  You have picked one of the leaders in the Machine General Group which you identified as moving several days ago.

  1. If you were a Type 1 or Type 2 trader (moment or day trader), you would have pounced then.  Since you are not, and are more a Type 3 and mainly a Type 4 investor, you should stay in your fox hole.

  2. For the very short term, if you want to dabble, you are getting your second chance today…but wait, RBN is correcting back into the base having made a BRAND NEW High.   

  3. The Group is “HOT” once again and rising as a WOLFPACK against the grain. You should watch the Group Movement first and then the individual Stocks.  Today, the group is taking a breather, having been up several days in a row, so if $51.62 is the low today and the market doesn’t tank, your best chance to get in will be at below $52 for a BOUNCE Play with a tight stop.  But if you do, remember you have changed your stripes to be a Type 1 day or moment trader when you buy.

 index

  • FYI, without a lot of research, FLS, RBN, WGOV, FSYS, BMI and SNHY are the overall leaders, but you will notice that four of those five are all being hit today and FSYS has given up $2 from its follow through day today at $42.42 down to $40.25.  On the other hand, a terribly beaten down stock like GENC is up 18.43%, so you know that was a great bottom fish.

warehouse

  • The bottom line message is “Timing” my friend…and your trump card is “Nimble” with “Tight” Stops.  If you want to “dabble” in this market, you will need to adapt to those three points.  He who hesitates is lost.

  • Lastly, think Wolf Packs first and Stocks within the Wolf pack second, which I am glad to see you are doing. 
  • As I finish writing I see that at 10:47 Pacific Time, RBN has repaired to $52.19 with a bid/ask spread of $52.17 and $52.25, so that speaks well for a possible recovery, particularly if the market is once again on the trot.  If not, all bets are off.

tracker          Net-net…you snooze, you lose.   Best regards, Ian. 

Copyright © 2007-2010 Ian Woodward
Disclaimer: Commentaries on this Blog are not to be construed as recommendations to buy or sell the market and/or specific securites. The consumer of the information is responsible for their own investment decisions.