Ian Woodward's Investing Blog

Archive for the ‘Market Analysis’ Category

The Bulls are Suffering from a New Year’s Hangover!

Wednesday, January 2nd, 2008

hangover

The Bulls are suffering from a New Year’s hangover…too much bubbly.  The Markets were rocked and Stocks fell sharply on the first trading day of 2008, reversing earlier gains after a key manufacturing report was surprisingly weak and as oil prices neared $100 a barrel.

The U.S. factory sector contracted in December for the first time in nearly a year as new orders collapsed.  The Institute for Supply Management said its index of U.S. manufacturing activity tumbled to 47.7% in December from 50.8% in November. It’s the lowest reading since April 2003 and the first sub-50 reading since January 2007.  The selling continued down as the markets broke down further, sending markets to the lowest levels of the day.  Retail shares traded lower on the first trading day of 2008 as crude-oil futures hit the $100 mark. Investors also awaited word of how retailers fared during the holiday season, their most significant selling period.  Retailers are set to report their December same-store-sales results on Jan. 10, and that will help provide an outlook for what’s in store for them in the New Year…but that is eight days away and in this market is an eternity.  Retailers’ sales at stores open at least a year in November and December combined are forecast to rise by 2.5% or less, according to the International Council of Shopping Centers.  Technology Stocks and the Steels were weak, but Energy Alternatives were strong.

The Dow Jones Industrial Average fell -220.06 points, or -1.67%, to 13043.96; the blue-chip index had been slightly higher just after the opening bell. The S&P 500 fell -21.2, or -1.44%, to 1447.16, and the Nasdaq Composite index was down -42.65, or 1.61%, to 2609.63.  The Yo-Yo Indexes show that the odds are we are headed down to test the recent lows.  The only scenario that can give the Bulls hope is a Bounce Play from an oversold market after four down days in a row.  Best regards, Ian.

indexes

Stock Market in the Balance – Year-end RonIandex

Saturday, December 29th, 2007

Balance

The weak Year-end Rally doesn’t bode well for the New Year and we come to the last day of trading with the Stock Market in the Balance and can go either way from here.  All the Indexes are at critical junctures at or near their 50-dma, their 200-dma and at support or resistance lines.  Is it any wonder that the two little fellows in the picture are asking each other if they are going long or short in this market?   The Sectors that have outperformed this year are essentially defensive with Energy, Materials, Utilities, Consumer Staples and Healthcare leading and smatterings of Technology, Internet and Telecommunications Stocks more recently.  Chemical Specialty and Energy Alternative Stocks have been outstanding and despite their huge gains will likely confound us and go up further.  Stocks like CF, MOS, POT, TNH, TRA along with FSLR, JASO, ESLR, CSIQ and new found ASTI are all defying gravity.  Technology Stocks which are holding up well are MICC, CRM, VIP, SIGM (recently pummeled but starting a come-back) along with the perennial favorites such as AAPL, GOOG, RIMM, GRMN and BIDU.  The Steel Producers may be waking up again and that should mean that STLD, MTL, AKS and SID should continue to lead that group.  Throw in ISRG, FWLT, PCLN,  and we have a well rounded group of Leaders.  

One popular theory often offered at the end of the year is that stocks laden with profits as these have provided over the year are held into the New Year before selling off to avoid Taxes in 2007 and delay them into 2008.  I don’t subscribe to that notion, but for posterity sake I felt we should go out this year with our best shot at the RonIandex for 2007.  If you haven’t seen Ron’s Year-end Movie which is out today I suggest you do so post haste.  His focus on the Volatility Index (VIX) which as we well know has grown dramatically this past year and the “jumpy gaps up and down” these past three months demonstrates that this is a very tricky market and one must be extremely nimble and short-term oriented at the moment.  There is no traction to show a continued rally or for that matter a steady decline.    I have built on his ideas to develop a consolidated Index of this group of 26 stocks and we will see if they get hit hard or continue to show leadership into the New Year.  As we can see the Index has risen above its 4-dma which suggests that the Index is healthy but over-extended.  Note how this group has hardly come back to its 17-dma, but if it were to break it, it should show us there is rotation underway.  I have brought back my Sherlock Holmes Character to show what you should look for on the third chart, where I expect the Index to emulate its past performance into the 3-std deviation area before it finally gives up the ghost.  I have purposely included four or five stocks in the three groups of Energy Alternatives, Chemicals – Specialty and Steels, so that we should immediately see the rotation should that occur. 

The 2008 New Year RonIandex:Wharehouse

Chart

watson 2

As Sherlock Holmes is showing you with his magnifying glass, we can see that ideally he would like to see the Index climb just below the 2-std deviation line (red line) as it did in the October 2007 timeframe (dotted blue ellipse), but should it stray up to touch the 3-std deviation blue line that will be a strong indication that the Index is way too extended and it would be wise to expect a correction in this Index.    Happy New Year and Best regards, Ian.

This was a Poor Santa Claus Rally – but Beggars can’t be Choosers!

Thursday, December 27th, 2007

silk

There is frankly little to report of any significance or loud cheer this past week.  Everyone is still buying up the bargains in the Malls at 6.00am in the morning and so there is little or no action in the Stock Market these last few days.  Sure we had a tepid Santa Claus Rally, but now reality is setting in and there is little for the Bulls to cheer about.  The Bears can already see that the rally is in the process of peaking and once again are licking their chops in anticipation of making money on the downside.  

Technology stocks closed in the red as the sector reacted to a weaker-than-expected durable goods report and the overall market was shaken by news of the assassination of Pakistani political leader Benazir Bhutto who was killed at a political rally in the city of Rawalpindi. Before the market opened, the U.S. Commerce Department said that durable-goods orders rose just 0.1% in November.  Were it not for strong orders for civilian aircraft, the durable goods totals would have fallen 0.7.  The bottom line is that the DOW fell a whopping 192 points to finish at 13,359.61, and the Nasdaq was even weaker in giving up 47.62 points to close at 2679.79.  In effect the Nasdaq today wiped out the gains of the last three positive sessions, and is now staring at taking out that huge gap down to 2640.  I’m no soothsayer, but today’s weakness going into Friday tomorrow suggests we shall close that gap unless there is some startling positive news to prop it up. 

I suspect that the Asian Markets will take a beating tonight which will add fuel to the fire for tomorrow’s session.  Needless-to-say that with many still enjoying the holiday spirit the volume was down these last three sessions, but once the New Year’s celebrations are over we can settle down to full participation once again.  The next important item on the cards will be the middle of the month when the first blush of Earnings Reports is due.  Let’s take a deep breath, finish off the remainder of the Egg Nog and then get ready for a fresh year.  Best Regards, Ian.

Bridge Over Troubled Waters

Saturday, December 22nd, 2007

bridge over

Santa came in on his sleigh, calmed the troubled waters for this past week and provided a bridge to the Santa Claus Rally and January Effect through glowing Earnings Reports from Research in Motion (RIMM) and Oracle Corp.  Likewise, shares of Nike Inc. had their biggest gain in six months after the world’s largest athletic shoemaker posted a 10% rise in profit, led by gains in Europe and Asia. The Dow Jones Industrial Average rallied 205 points to 13,450, adding up to a 0.8% gain for the week. The S&P 500 Index gained 24 points to 1,484 Friday and 1.2% this week.  Most of the fireworks were seen on the tech-laden Nasdaq Composite Index, which powered ahead with a 51 point-gain to 2,692 Friday, ending the week up 2.1%.   With rising concerns that the housing market and tighter credit will lead the United States into recession, investors have found some comfort in the hope that technology companies and other multinationals can still benefit from global growth.  

What should also stiffen the Bull’s backs is that the Small Cap Indexes such as the Russell 2000 (RUT) and the Small Cap S&P 600 Indexes had the best day on Friday and bodes well for a continuation of the rally into the January Effect.  Note the following insights from the Chart of the Top’s Down Analysis that my good friend Ron Brown always uses in his weekly movies: 

  1. The Russell 2000 Index and Small Cap 600 Index are at the top of the list
  2. This was a strong Accumulation day which included Triple Witching with Advancing Issues and Advancing Volume leading the Decliners by wide margins of 5:1…between friends.
  3. The Volatility Indexes are at the bottom which is a good sign. 

top down 

Please don’t misunderstand me in that the Large Cap Leaders are still leading…witness the explosive move naturally from RIMM.  However, what I am suggesting is that if this Rally is to continue just make sure you watch the Russell 2000 for this next week or two to make sure the momentum is still fanning the January Effect.  The RUT chart pattern is in a trading range and has been the weakest of most of the indexes, so it still has a ways to go to get above the 200-dma.  However that is precisely what we need to watch to see if the momentum is strong enough to blow through that resistance or whether it will fizzle out as usual at or near the 200-dma.  As you can see from the chart below, the 50-dma (blue line) is already below the 200-dma, red line which in itself shows how weak the small cap index is.  If this Index blows through the 200-dma, that could give fillip to the entire market in the short term as the other indexes are a lot stronger.

      rut  

 Best regards, Ian.

Technical Analysts on the Horns of a Dilemma!

Thursday, December 20th, 2007

       horns

U.S. stocks finished higher on Thursday, as blow-out profits from software-maker Oracle Corp. and from Research in Motion Ltd. after the close helped overcome continuing troubles in the financial sector. Research In Motion Ltd. (RIMM) saw earnings more than double for its third fiscal quarter amid continued strong demand for the company’s BlackBerry line of smart-phone devices. The wireless device maker also issued a better-than-expected forecast for the current period.

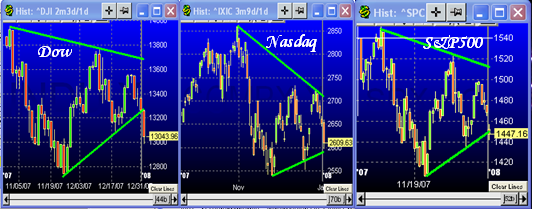
The market struggled throughout the session after bond insurer MBIA Inc. reported a large exposure to risky debt and Bear Stearns posted its first-ever quarterly loss.  But the Dow Jones Industrial still finished up 39 points at 13,246 after a late surge.  The S&P 500 index gained 7.1 points to 1,460, while the Nasdaq Composite gained 39.9 points, or 1.5%, to 2,641.  However, the after hours earnings report from one of the big horsemen…RIMM, should at least give a boost to the Technology stocks first thing tomorrow.  Don’t forget it is Triple Witching on Options Expiration tomorrow, so be prepared for another wild and wooly day.

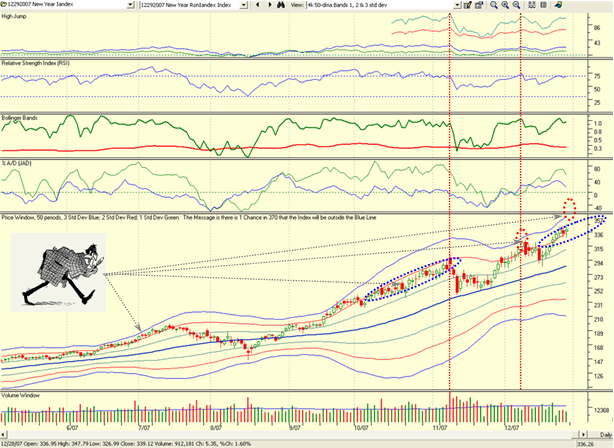
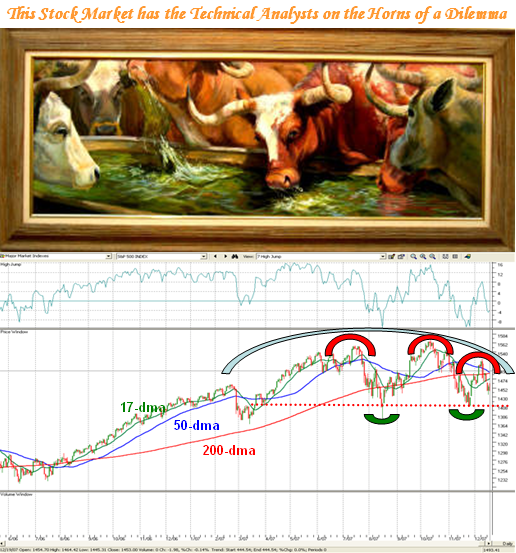
Coming now to the theme of this particular Blog, you can see from the diagram above that we are right at the fork in the road.  Depending upon your leanings and whether you are bullish or bearish, we either see the glass half full or half empty.  The Chart on the S&P 500 above shows the High Jump or in this case we need to look at the bottom of that piece of the chart, we see that we have had two lows put in on the “Limbo Bar” in keeping with the lows shown by the double bottom with green ellipses on the S&P500 Index.  Two corrections of over 10% for the S&P 500 is a trifle unusual, unless this is signaling the beginning of the end of the long rally since the start of 2003. 

Markets seldom rollover in a hurry unless one has a 1987-like crash and then they are usually short lived, though the damage that ensues from panic selling can cause a two year wait to recover on many stocks.  So, if this is the start of the bear’s favorite scenario then there are three points that I can address for you from the chart above:

  1. I show the makings of a rounded top with the semi-circle ellipse in blue.  It will take a fresh rally to a new high to negate that look on the chart.
  2. We can clearly see the makings of a head and shoulders top with the three red ellipses I show.
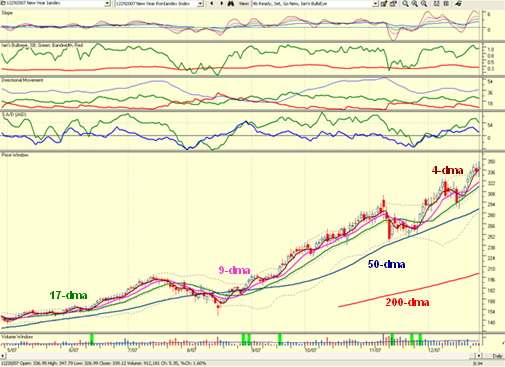
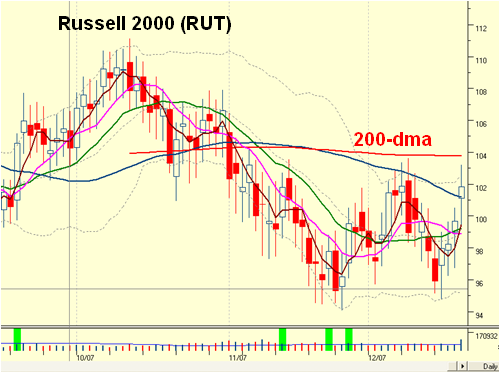
  3. When the 50 day Simple Moving Average (SMA) crosses below the 200 day SMA, it is called a “death cross.”  When the 50-dma crosses above the 200, it is called a “golden cross.”  As you can see from the chart over on the extreme right we are very close to the 50-dma (blue line) coming down through the 200-dma, the red line. That doesn’t have to necessarily mean a catastrophic failure and is really only significant when we truly break the uptrend for a long Bear Market as occurred back at the top of the market in 2002.  Note that the chart shows on the left-hand-side that we last had a death cross back in July-August of 2006. Here are the statistics of the several breeches of the 200-dma since 1990: 

          chart

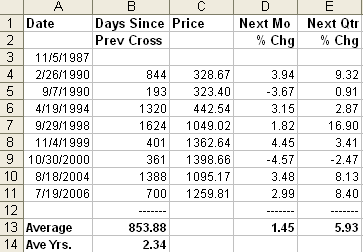
As the chart shows the really ominous occasions were when we had a bear market in 1990 and again from 2000 to 2002, which I need hardly remind you was brutal.  The negative numbers on line 9 can be a trifle deceiving as the 50-dma never recovered to get above the 200-dma for all of two years.  Otherwise, when the market is still in a rally, these so called death crosses are a trifle innocuous as the next month and three month readings show. 

However, in the event of a downturn, this little bit of statistical history does give us a measuring rod for the expected minimum downturn in the S&P 500 for the following month AFTER the cross takes place.  We should expect a further 4% between friends from that point.  Using 1460 as the starting point, a 4% correction would take us down to 1402 which again would be tantamount to a double bottom as a minimum within a month from it happening.  We must realize that we are already down -7.4% so that would mean three corrections of over 11% in a matter of six months, which demonstrates the extreme volatility we have to put up with.  That in itself is a decent clean out.  Please understand there have been deeper clean outs of -13.89% and -9.68% in 1962 and 1946 for the next month, but I prefer not to go further back than 1990.    

I repeat something I have said before that the only saving grace for the bulls is that unlike the 2000-2002 timeframe, the overall P-E even allowing for catastrophic performance in the Financial Sector of the market still suggests that we are either undervalued or at most fairly valued.  After all, 17.2 P-E is the historic average based on 56 years of my studies on the S&P-500.  Assuming there is no gain in Earnings in 2007, and using 85 as the yardstick for 2006 for the S&P500, we get 17.2 P-E!  Amazing what one can do with numbers to make a point, but there are no tricks up my sleeve on this one…those are the undisputed facts, unless one is a glass half empty type and believe that a decent correction to make the Market attractive to the Value Investor suggests a P-E of 15 or less. In which case they would set their sights on 1300 for the S&P give or take 10 points.  I could be wrong but that seems to me to be wishful thinking…we shall see.  If the likes of RIMM and ORCL can turn up trumps with earnings as we have just seen, then for sure it will mean that the sub-prime loan ramifications are of an unprecedented nature affecting Global Markets to more than dampen the expected turn up in Company Profits which keep rolling in at a good rate.  

In Summary:

  1. Long-term buy and hold types should be prudent, patient and pounce from their foxholes later.
  2. Intermediate-term players of the swing type for a few days or weeks grab what you can get if you use your trump card of being extremely nimble, but you need to play both sides with equal vigor if you are that quick that you can not only see the day-to-day swings, but also the INTRA-day wild rides that are completely commonplace these days.  Otherwise you will lose your shirts even faster than the day-traders.  
  3. Short-term day traders now trade in moments and they know what they are doing or else they lose their shirts. 

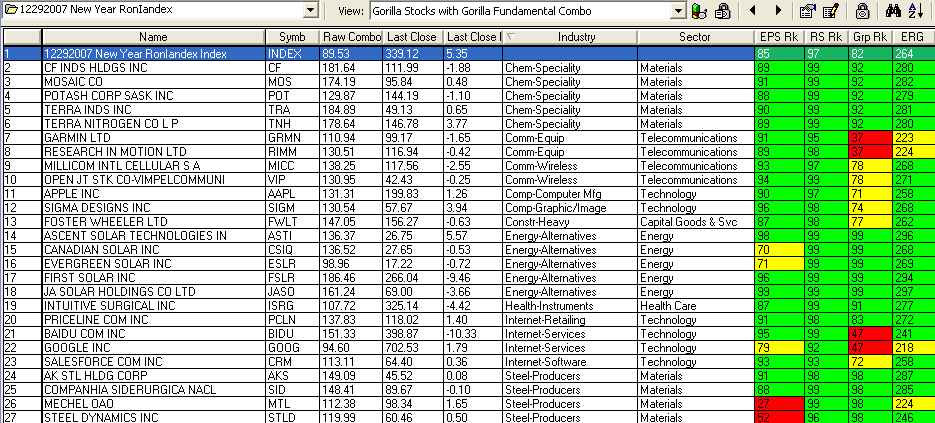
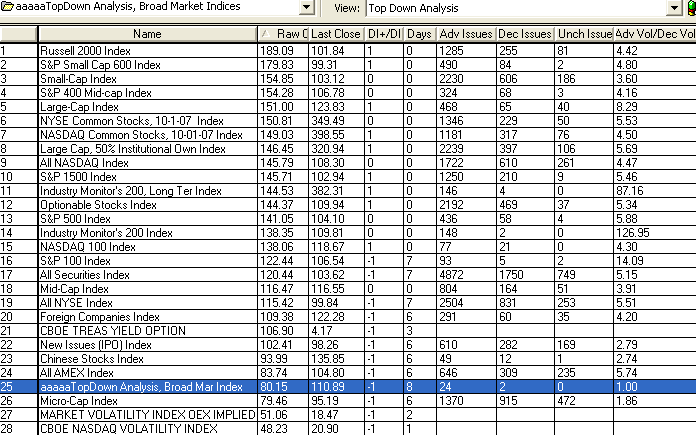
It is very obvious to me where the money is being made…they are heading back time and time again to the Nasdaq 100 either on bounce plays or going high to go higher on pullbacks.  Also on the downside the quickest way to make big returns is the “double” ETF’s such as the FXP and the QID, but heaven help you if you can’t be quick.  The NDX was up 1.9% today outstripping the Nasdaq which was up 1.53%, while the laggards were the S&P500 up 0.49% and the DOW up 0.29%.  So I suggest you trot back to the previous Blogs where I cover Silverbacks and Chinese Silverbacks and find your oysters.  Better yet, select All Securities, hit the 9 or 0a keys for filters and use the Gorilla and Fundamental Combo rank filter to find the best stocks today.  If all of that is too much for you then use ERG >250 and Accumulation of >=B and you have the Sprinter Filter that my good friend David concocted…a cool dude who is a super fast learner.  No flies on him, only blue bottles!  One tip is to make sure these stocks have not corrected more than 15% from their highs.  You will be disappointed with fiddling around with broken stocks that are fallen angels that have lost their halos.  The Transportation-Shipping with the likes of DRYS, EXM, and NM are such examples.  Best regards, Ian.

Copyright © 2007-2010 Ian Woodward
Disclaimer: Commentaries on this Blog are not to be construed as recommendations to buy or sell the market and/or specific securites. The consumer of the information is responsible for their own investment decisions.