Ian Woodward's Investing Blog

Archive for December, 2008

What’s Needed for a Strong Bear Market Rally?

Sunday, December 28th, 2008

Sad to say after all that encouragement from the sidelines, the Santa Claus Rally
fizzled and we have to hand it to the Grinch who won this round this year.

                              grinch

At least we have made a start towards repairing the rot that set in back in September
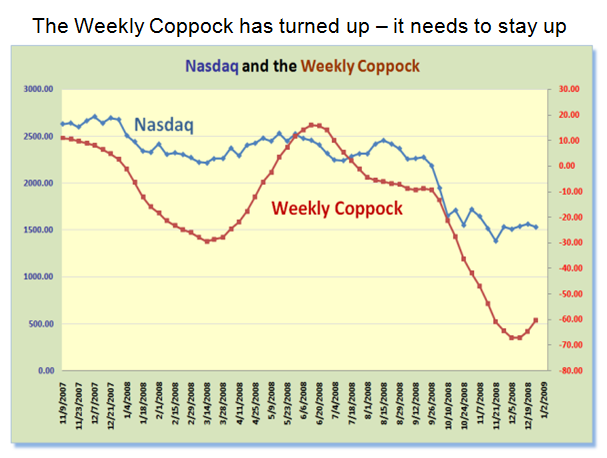
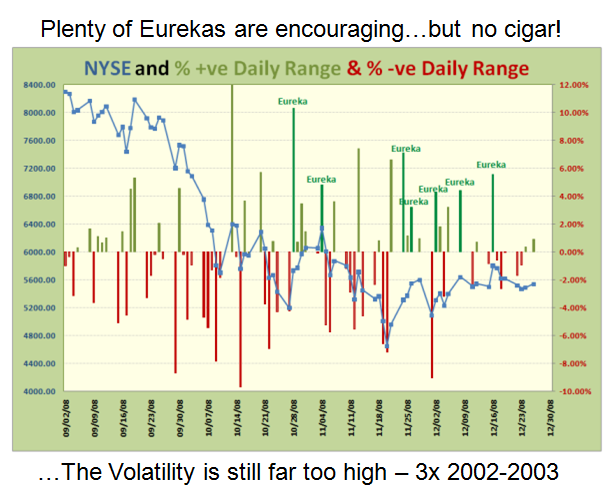
in that the Weekly Coppock has turned up and there have been plenty of Eurekas
indicating that the Bulls are trying hard to hold the bottom.

coppock

eurekas

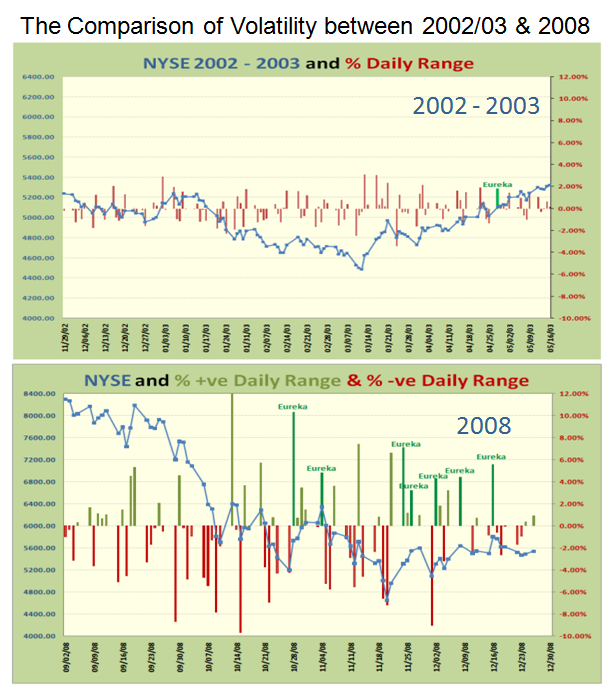
Unfortunately, as I have indicated many times, we have endured terrible Volatility.
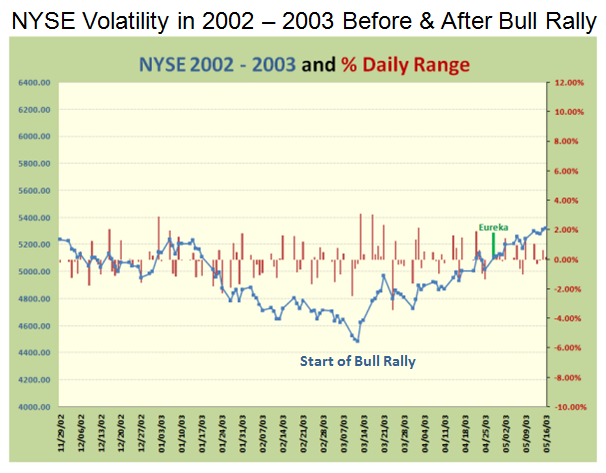
Just look at the difference between the % Daily Range of the 2002-03 timeframe
compared to now.  I have purposely kept the scale the same so that we can see the
major difference between the two.  It is all of three times worse now.

2003

both

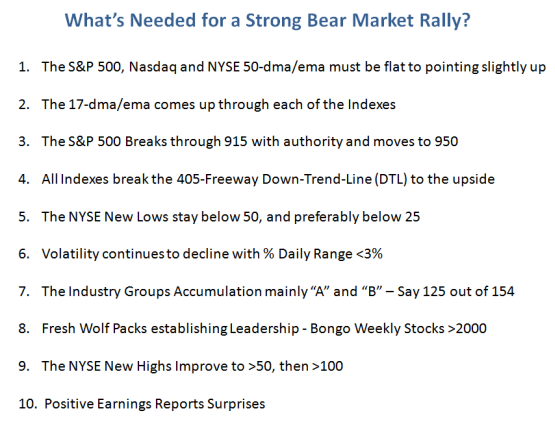
The $64 question is What does it take to get this Bear Market Rally kicked into High
Gear?  Here are 10 items to watch, but I am sure we all have our own favorite list and
I have left many other items out…but these should show a Maturing Bear Market Rally.

list

Best of luck for a Happy New Year from the HGSI Team…George, Matt, Ron and Ian.

Half a Loaf is Better Than No Bread!

Tuesday, December 23rd, 2008

Mail-Bag:  My wife’s 401k is down 50%.  She is asking me if she should sell now and buy back later at a lower price.  I have no idea what to say at this point. Have any ideas?

Answer:  You are lucky as by this time my wife and I would be enjoying our grandkids, but like this Santa Claus Rally, the snow put a dent in our plans.  I don’t give advice, but I will break the problem down for you and show you a Game Plan.   Let’s review what makes sense at this stage.  Since I presume you follow my blog, I would suggest you continue to do so to give you and her clues as to what to do:

1. It goes without saying that many have experienced the same fate as your wife with their 401-K.  50% down is a terrible hit as it will take 100% to get back to where she was.  But that is water over the dam at this stage though it will take at least two years to get back to where she was if it doesn’t go down any further.  That is a pure guess, but in terms of time it assumes we not only have a Bear Market Rally but also it recoups into a full fledged Bull Market again soon.  Not very likely.

2. Invariably people throw in the towel when they have taken such a hit and feel that half-a-loaf is better than no bread.  Sad to say that many times that turns out to be right at or close to the bottom.  If anyone can tell you that we have reached a bottom and hang on…think again.  Not even Warren Buffett can do that, but he can afford to get hit as is T. Bone Pickens as they have deep pockets.  Hence the dilemma you face.

3. Since we have some breathing room with the recent Base Low on the S&P 500 at 741 (see many of the recent blogs I have put up which show the Lines in the Sand), we have at least bounced back about 24% from that low to its recent high.  It is currently about 17% up from the Low and hanging on by a thread.

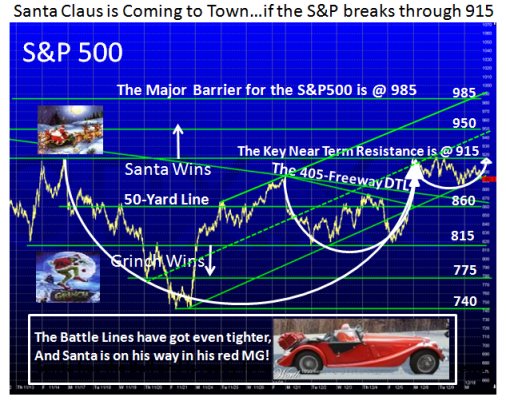
4. If you look at the Santa Claus Blog written on December 6th. with him sitting in his Red MG (I have saved you the trouble by providing it below), you will see there are three lines in the Sand to the Down Side:
half

a.  The one at 860 which is the 50-yard line and is where most of the action will  meander back and forth as it is right now.
b.  The next important line of support is at 815 where I show anything below that the Grinch wins
c.  The final line is at 740 and if that is broken to the downside, expect the floodgates to open and who knows where it will bottom next.

5.  Again, if you have followed, the Upside scenarios suggest that:
   
    a.  The first hurdle must be above 915 which it hasn’t penetrated as yet and is meeting stiff resistance at that level
    b.  The next one is at 950, which is 33% up from the Base Low of 714.  If it achieves that, it will be deemed as a very good Bear Market Rally.
    c.  Anything above that is sheer gravy at this time, and is wishful thinking until we get past the first two targets.

6. With the Global Market scene as bleak, the intermediate term and long term bias has to be to the downside for now.  The best one should expect is a short-term Bounce Play (Call it a Bear Market Rally) if it can get above 950.

7.  So her strategy should be fairly clear from here if you read between the lines:

     a.  If it goes up from here through mid January say and gets above 915, then 915 becomes her line in the sand to vacate should the market turn down, and she would at least have recouped something in participating in the Bear Market Rally and then vacating when and if the Bear Market resumes downwards.  Since she can watch how her 401-K behaves as it moves up and down, it should not be difficult to see whether she is making any headway or not and then make up her mind. 

    b.  If it never gets above 915, then her 1/2 a loaf scenario is the choice somewhere between 860 and 815, because her stomach tells her so!  Since she has already experienced what it is to be down at 714, she will soon know where to call it quits. 

   c.   If she waits until it gets below 714, she will be further in the mire and telling you “I shoulda, coulda, woulda”, kicking you in the shins and feeling “now I will never be able to retire!”  Ready, aim, aim aim and never firing is what got her into trouble before. 

The lesson learned Rob is that our whole life revolves around threes.  What better evidence than the rules of the road with traffic lights as Green, Yellow and Red.  Always break complex problems like this into three scenarios…the high road, the middle road and the low road, as I did in 7 a, b, and c. Under these circumstances, unless there is a miracle wand waved over the overall global gloom, don’t give up the half a loaf to see that evaporate when the market tells you it is headed down again.

As I say I do not give advice and anything I say is “ALWAYS YOUR CALL”, but there are many people in the same boat as your wife and this may be of help to them too.  My notes are written to help people understand the Stakes in the Ground and the Measuring Rods and most understand what to do once they have a reasonable Game Plan developed.  The rest is up to each individual as to what their stomachs can bear.

Best regards, Ian.

Seasons Greetings and all Best Wishes for 2009

Monday, December 22nd, 2008

Seasons Greetings, thanks for your continued support and all Best Wishes for 2009 from the HGSI Team…George, Matt, Ron and Ian.

Enjoy this wonderful video of the Drifters…just click on the link below; then, when the video is finished, hit the return arrow at the top of your browser.

drifters

http://www.youtube.com/watch?v=ddVZOK_9UUI

Volatility, the VIX, S&P 500 and High Jump

Sunday, December 21st, 2008

scene

Since most of the country is blanketed in snow at this time of the Year, the Picture above is the HGSI Team’s Seasons Greetings to all of you our loyal supporters and to the blog friends we have made around the world.  Consider this blog as my Christmas Present to all of you.

case

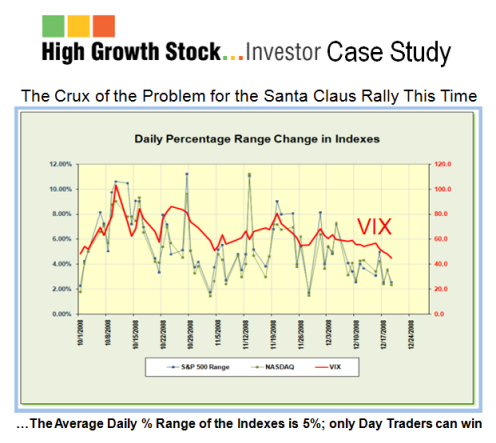
In an earlier blog just two weeks ago, I showed the Daily % range change in the Indexes together with the VIX since October 1.  I noted that “the Crux of the Problem for this Santa Claus Rally is the fear exhibited by this chart which shows the average at 5% (between friends) together with a VIX >50!”  At the time I did not know how these few weeks going into the traditional Year-end and the January Effect Rally would pan out, but I felt I should revisit this concern and shed more light on the subject.

The intent of this Case Study is to see:

1. The Volatility as expressed by the VIX and the % Daily Range of the S&P 500

2. The extent of the extreme Volatility the Market has endured these past four months

3. If there are any signs of an abatement to this high Volatility

4. The Positive & Negative swings and Nasdaq, Bingo & Eureka for the past four months

5. The comparison of the past four months to what preceded it the previous 12 months

6. If the High Jump Indicator could shed any light of the Volatility in 2002-03 and now

So let’s take them one at a time as follows:

vix

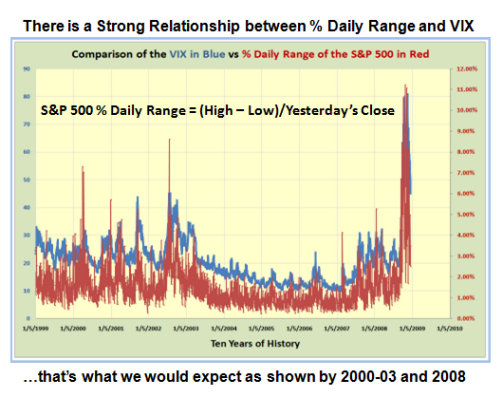
As we can see from the chart above there is a strong correlation between the % Daily Range of the S&P 500 and the VIX.  % Daily Range is defined as the (High – Low)/ Previous Day’s Close, expressed as a percentage.  Note the spikes that occurred back in 2000 to 2003 just as we have now, though the % Range and the VIX Readings were much less than now.  However, also note the extreme volatility is also accompanied by big spikes in the % Daily Range readings, which was shown in the previous chart, confirming the strong relationship.  There is nothing novel in this since my friend at VIX and More has very eloquently described long before now.  I recommend you visit his site.

stats

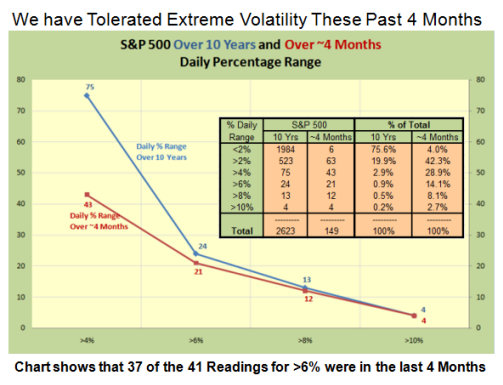
This chart is an eye-opener as it shows in a flash the extent of the extreme readings in % Daily Range these past four months compared to that over a 10 year period.  Over a long period of time the normal expectation is a % Daily Range of <2% which occurs three-quarters of the time.  95% of the readings are under 4%.  37 of the 41 readings above 6% this past four months is a staggering  90% compared to 10 years.  The conclusion is that the Market Fear Indicator has been in Oscillation!

signs

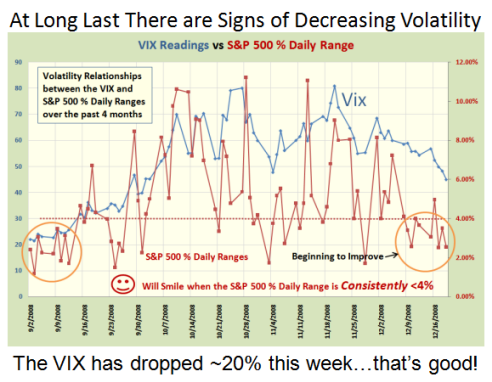
The chart above shows the extreme readings of over 11% with very few below the 4% mark.  However, note that in the past ten days with the tight “handles” produced in the S&P 500, and for that matter in all the other indexes, the volatility in the VIX has dropped substantially along with a drop in % Daily Range to below 4% for the most part.

longer

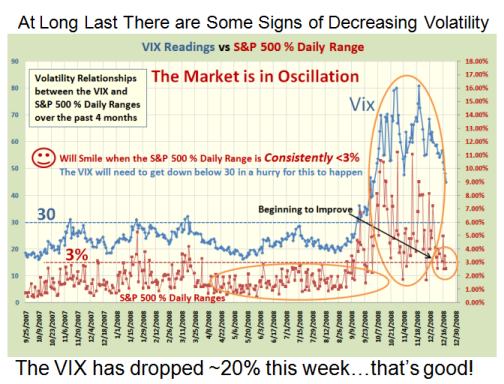
This chart shows a longer term view of where there was some degree of normalcy despite the fact that we had chalked up several readings in the VIX of ~30.  The Bears are a trifle concerned at the recent drop off in the VIX, but are hoping that it will find support at the 200 day Moving Average and bounce higher. The Bulls will only smile when the S&P 500 % Daily Range is consistently <3%, and the VIX gets down below 30 for this to happen.

ebb

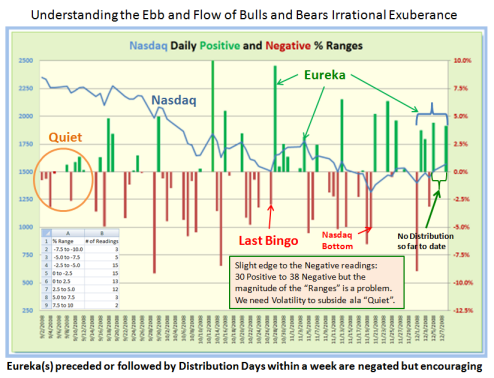
This chart shows the Ebb and Flow of the Positive and Negative swings by the Bulls and Bears, and the Irrational Exuberance expressed by the Eureka signals we have come to respect as a sign that there is at least some interest by long term value investors to grab some tasty morsels in the hopes that we have reached a bottom for now.  The updated late breaking news is that we had yet another Eureka this past week (not shown on the chart), but the Market Indexes are all stuck in a trading range.

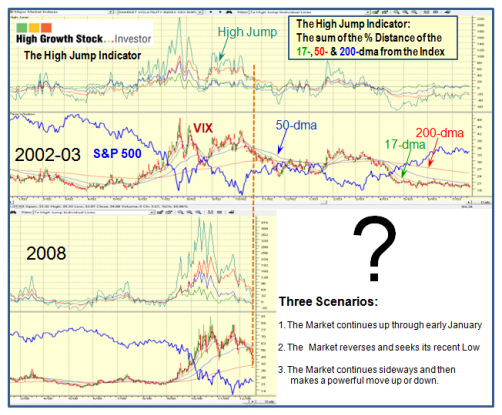
Now comes the tricky part…which way does this tepid Santa Claus Rally go…up, down or sideways?  I felt it might be fun to bring out my trusty High Jump Indicator and show its value in another form.  The chart below shows a comparison of the High Jump for the 2002-03 timeframe and now in 2008.

Some have noted that this tight trading range is very unusual for all Indexes showing identical patterns that it suggests a coiled spring and a dramatic move one way or another.  Others suggest that it is not surprising that the market is meandering in a trading range.

high

There are two ways to line up these charts, either have the Peaks of the High Jump in line or the cross over of the 17 and the 50 Day Moving Averages.  I chose to use the latter as shown by the dotted Orange Line as that shows the current momentum which is down for the VIX.  Tomorrow will be critical to see if all the Market Indexes can push through their stiff resistance which I have previously explained before is at 915 for the S&P 500.  Although the Index is now 24% up from the Base Low of 714 which is a point at which many rallies get turned back, my feel suggests “Up” for now, but who am I to say.  I base my bias on the fact that the Internals of the Market such as the % of Industry Groups above 50-dma is now at 80, the Number of “A” and “B” Accumulation Groups is 22 and 111, respectively, and Bongo Daily and Weekly Stocks are at 3165 and 1794, respectively. These are numbers we have not seen since June of this year.

Seasons Greetings and all Good Cheer to you and yours.   Spare a thought for the HGSI Team.  We like to hear from you.  Ian.

P.S.  If you have never tried HGS Investor sign up for our free 60 day trial.  www.highgrowthstock.com/trial

Eureka! The FOMC Kicked the Rally into Higher Gear

Tuesday, December 16th, 2008

dance

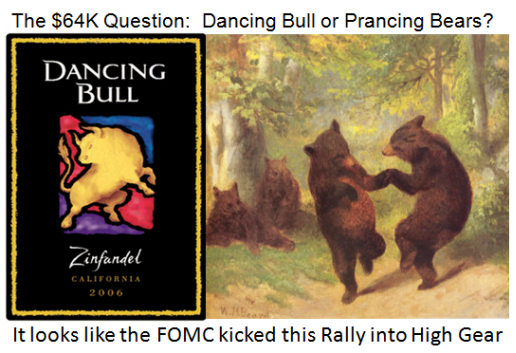
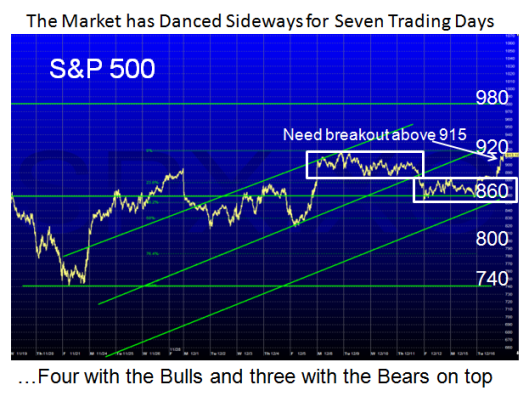
The Santa Claus Rally which was stalled for the past seven days with a stand-off between the Bulls and Bears may have got the punch from the FOMC it needed to kick it into High Gear.  Helicopter Ben came through with a surprise of more than a 75 basis point cut in the rates which drove the Market up by at least 200 DOW points from the time of the announcement at 2.15 pm to the close at 4.00 pm.

After four days of trading in a tight range between 885 to 915 with the Bulls threatening to
break through to higher ground, the Bears got control for almost three days before the late breakout this afternoon.  The Bulls are knocking at the door once again, and need a push through 915 with vigor to press on towards the target I had previously set at 950.

sandp

The question then arises as to what might be a strong rally for what is considered a Market in deep recession and tinkering on the brink of a depression as we see all the gloom and doom which raises its ugly head on almost a daily basis.

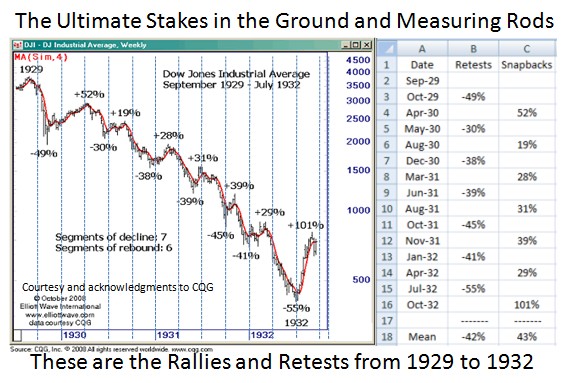
There is precious little previous numbers to turn to which may have set a precedence unless we trot back to that dreaded period back in 1929 to 1932 for anything resembling big drops and succeeding Bounce Plays and/or Bear Market Rallies.  So here is what I have been able to dig up on that score.

1929

It suggests that now that we are now 23% up from the recent Base Low of 741,  we can at least expect a continuation to the 28% to 30% level as seen from the numbers in Column C.  That would give us a Range of 948 to 963.  We can discount the 52% and 101% legs for now, and the very best we could expect if history is to repeat itself is 1030, but let’s take one big step for Santa Claus before we even think of such giddy heights for mankind.  There are probably still too many hidden skeletons in the closet which have not been uncovered, but at least the strong stance that the FOMC took today is to focus on the Deflation issue and kick the can down the road to worry about Inflation later:

1. Understand that the Dollar Index has fallen and this particular item needs to reverse.  Watch it like a hawk to see the effect of this recent move by the FOMC.

2. Likewise, the jolly old VIX has trotted around 50 to 80 for far too long and we need to see if this shot in the arm can allay some of the fears and pull the reading down quickly to the low 40’s at least.  The VIX pundits make a case that since the extreme readings it could rise to about 57 by February 2009 and we could have to wait until 2010 to see it meander down gradually to the mid to low 40’s!

3. The number of New Lows has come down on and off to below the 50 level of late, but the New Highs on the NYSE have languished at under 10.  This is of necessity a laggard indicator but if the Rally is to show any signs of real strength, all boats need to rise quickly.

4. Of course the other internals such as the Accumulation/Distribution, # of ERG stocks above 240 and the # of Daily and Weekly Bongos “Yes” must skyrocket now.  I showed you all of this in the December Newsletter which was published yesterday.

5. Last but not least for this to be a sustained rally, we need to see Leadership by way of stocks with strong Earnings, tight chart patterns move above the 50 and 200 day moving averages.  Whether you use “sma” or “ema” is immaterial at this point in the bigger scheme of things, but some Technical Analysts prefer the exponential to the simple moving averages and I bow to them all to make their own call.

Best Regards, Ian.�

Copyright © 2007-2010 Ian Woodward
Disclaimer: Commentaries on this Blog are not to be construed as recommendations to buy or sell the market and/or specific securites. The consumer of the information is responsible for their own investment decisions.