Ian Woodward's Investing Blog

Archive for November, 2009

Goodbye Dubai, Hello Qatar!

Sunday, November 29th, 2009

My good friend Kevin from Qatar wrote me a note and a question, so I just could not resist answering him with this caption:

        dubai

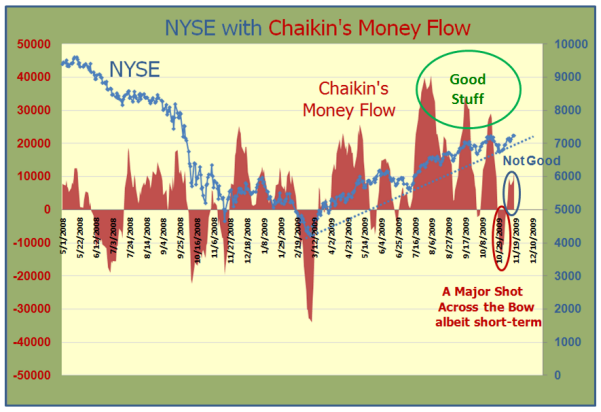
Ian, When I chart the money flow index against the market ETF’s like DIA, IWM, QQQQ, MDY, and SPY, I think I am seeing negative divergences with the Money Flow Index generally peaking July 28-30 and since then a series of lower highs and lower lows (QQQQ being something of an exception).  If not broken, would it not at least indicate that the uptrend has substantially weakened?  Or maybe the better question is: What is the implication of the negative divergence?

Best regards, Kevin in Qatar

Hi Kevin: It’s good to hear from you and as you correctly point out…this market is suffering from “Nasal Catarrh”…only you and I can share that joke from a year ago, with you coming from Qatar.

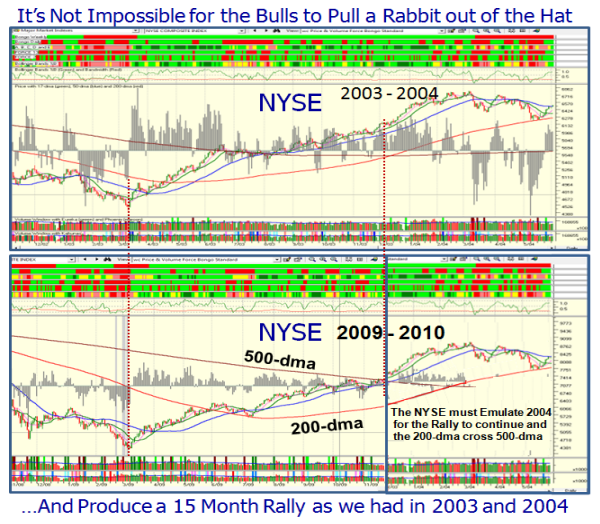
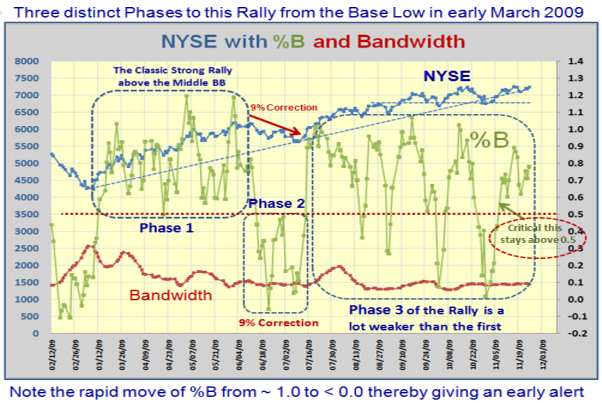
Ron’s Weekend Movie addressed the problem of the divergences in volume these past few weeks and it certainly means that both Buyers and Sellers have pulled in their horns at this time of the year.   Part of the problem is seasonal in that the holidays and half days can throw one off, but I have noticed that this second up-leg in the rally after the June/July hiatus of a 9% correction has been a lot weaker.

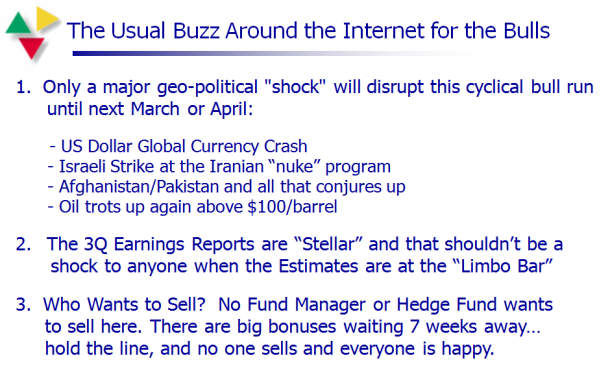
It was just as well the market was closed for Thanksgiving as much of the Dubai shock was absorbed by the global markets while we enjoyed Turkey.  It was pretty obvious that the big gap down on the opening was inevitable and the mood by the time Friday came around was that this was a buying opportunity, which is essentially what happened albeit on a shortened 1/2 day to play, and hence the light volume.

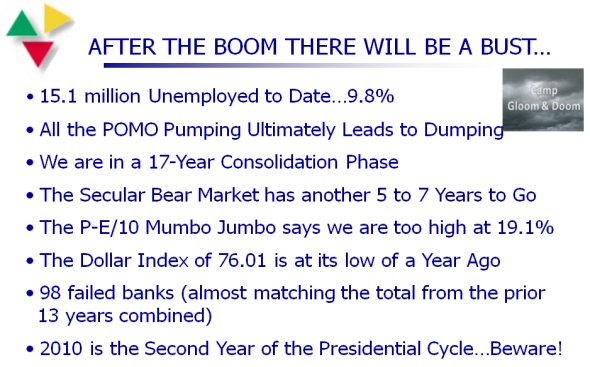
None-the-less, your overall observation that the Market is generally running out of steam is correct and there is at long last an awakening by the herd that the pumping of “QE” aka, Quantitative Easing, aka, Monetization Program, aka, POMO and other such gobbledygook for Fed Speak is fast coming to a close…though there are whispers of a QE2, mind you!

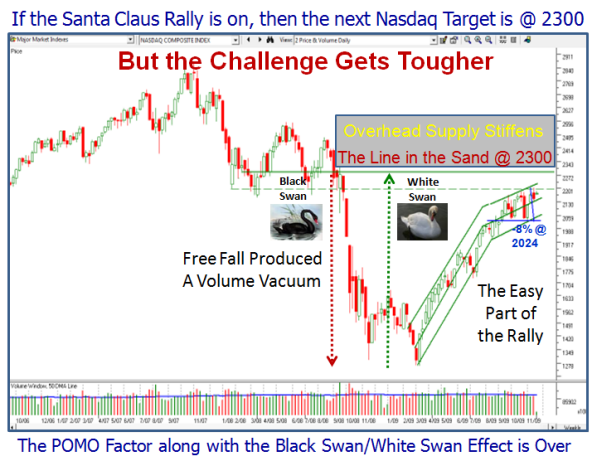
To confirm what you have observed, just trot over to the last blog note I put up for Thanksgiving and you will see that the Black Swan/White Swan Scenario is petering out and I purposely drew the channel lines to show a bending of the curve.

Likewise, there is a certain rhythm to the behavior of the market these last three months where it tops around the 3rd week of the month only to find a bottom by the 1st of the month…and it looks as if we are headed that way one more time.

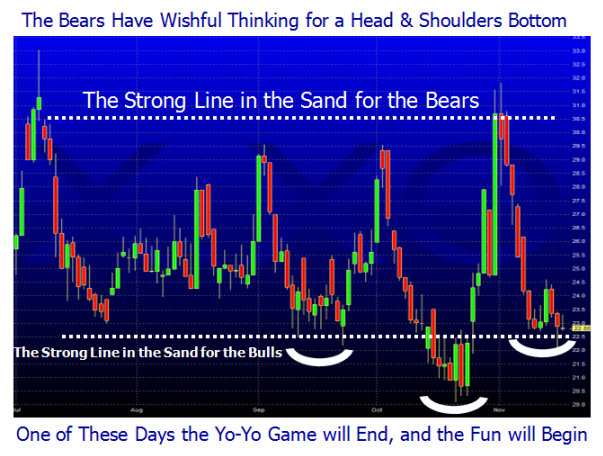
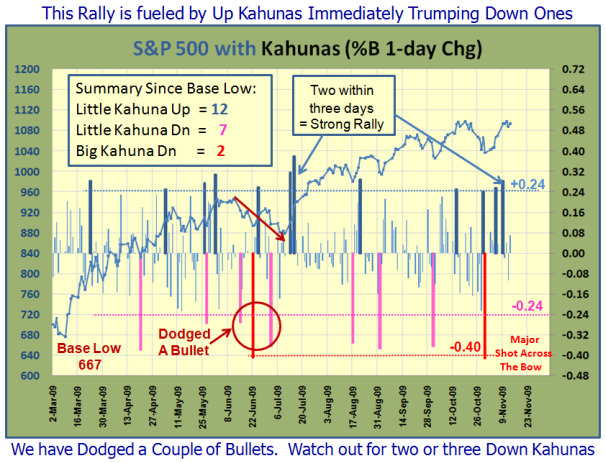
There is no better way to show you the underlying jitteriness of the market than to use the wide swings in %B of the Bollinger Bands for this second leg up compared to that of the first leg where the swings were all contained in the middle to upper BB’s.

nyse

My work tells me that if we have two little and/or big Kahunas in a week followed by a third one soon thereafter that the party is over. Also, watch out for a %B reading of worse than -0.2 as that spells disaster to come.  Expect at least an initial drop of -5% to -7% in a matter of 10 to 15 calendar days.  So, you are all forewarned.

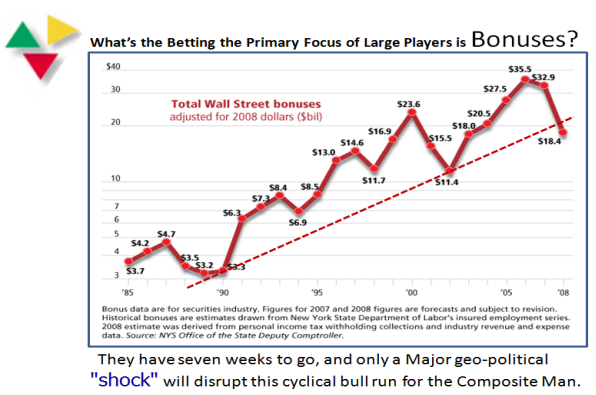
But first, the primary focus is “Let’s keep the ball rolling upwards, so that we can all collect our fat bonus checks, then we will worry about the inevitable swoon…All for one and one for all”!  It will take more than a Nasal Catarrh to break this theme. 

Best Regards, Ian.

Come Fly with Me is the Bulls Wish for Thanksgiving

Wednesday, November 25th, 2009

           pilgrims

It hardly seems another year has passed since we, the HGS Investor Team, wished you a very Happy Thanksgiving with our special thanks to you all for your continued support.  This time last year we were all in the doldrums but there was a ray of hope for a Santa Claus Rally.  It seems we might have a similar opportunity this year.  At least that is the wishful thinking of the Bulls.

matador

The “Hope” is that the Market is in a similar Bull Rally to that of 2003 and early 2004 when it had a run for 15 months.  So far the Market has rallied over 60%, has taken a breather for the last month struggling to get its nose above the old highs and seems to be trying to make another run.  In the chart below I show what the NYSE has to do to repeat 2003 in the bottom right of the chart.  With luck the NYSE can drive for 8000 if the Rally is on:

nyse

At the October HGS Seminar, I suggested that since the Nasdaq had broken through the 200-dma High Jump of 25% up, the next Target would be best measured by using the 50-dma High Jump and offered 2200 as a likely target. We got close when it hit 2190 a couple of days ago, and if it can break through again, the next target is 100 points higher at 2300 as shown:

nasdaq

However, as we can see from the next chart, the Challenge is getting tougher as most of the opportunity from the free fall this time last year has been recovered and we have almost recouped the volume vacuum that the Black Swan gave us.  Also the Permanent Open Market Operations (POMO) which the Fed pumped in since March is now over, so we have only the usual Santa Rally to hope will keep this market up.  Don’t forget that it behooves Wall Street Fund Managers to rally this market until their Bonuses are assured, but after that there are slim pickings:

swan

All the best to you and yours fror a Happy Thanksgiving.

Ian.

Is Your 401-K Nuddled Hollywood Style?

Wednesday, November 18th, 2009

I haven’t gone balmy, but I couldn’t resist using the latest crazy novelty from Hollywood to make a point about nuddling your 401-K.  I know you enjoy the “cartoons” I use to give the gist of the message…it takes me more time to scour the Internet looking for ideas to fit the message than it does to write it!

   nuddled

Anyway, my last few messages have been a trifle up beat with the Santa theme, but let’s not get too carried away with irrational exuberance, though it is a joy to boost our spirits with something positive to say at this festive time of the year.  Even the disappointing news on the Housing Market was sloughed off today, and the VIX hit a low of 21.63 at the close to add to the calm.  Of course all the pundits keep shaking their heads in wonderment and indicating that some day the Yo-Yo Market with an upward bias will slowly but surely come to an end.

Ron and I gave full treatment to both the upside and downside at the Seminar, and it goes without saying that the airwaves are full of scenarios for both, particularly when this market stubbornly inches higher.  The intra-day and few days trading artists are quick to point out that we now have an Inverse Head and Shoulders Bottom on the VIX and that is true as shown below.

vix

I have shown the yo-yo picture for the VIX umpteen times before now as to the lines in the sand and so there it is one more time.  As you will see nothing has changed; we still oscillate between 22ish and 30ish with monotonous regularity.  Nimble-be-quick will always get a short term trade one way or another when we get the famous Connors 10% above or below the 10-day MA good stuff.  So what’s my point?  This stuff becomes regular fodder to chew on, as short term artists will always know which way the wind is blowing with these wind gusts for such moves. 

But what do the Type3’s and 4’s do with all of that?  Nothing…they either get whipsawed, stay out and wait patiently, or have given up waiting and get in biting their finger nails.   The higher it goes the worse it gets the later they get in.  Eventually, the Big Players are pulling out when the Little Players are frothing at the mouth and falling all over themselves to get in.  In times of long rallies in the market over several years as we enjoyed during 2003 to 2007, it was easier to spot this phenomenon and it can be said in two words that saved our bacon, i.e., Hindenburg Omen.  It is most unlikely that we will see that Indicator sprout up at this stage of the Market Recovery.  However, as HGSI Users we are a lot stronger in spying early warnings of what to look for.  Let me demonstrate that to you with just three charts. 

This chart draws on our experience of how the Kahunas have behaved these past ten months.  A Kahuna is a 1-Day Change in %B of the Bollinger Bands of 0.24 or 0.40 either up or down:

kahunas

Note that the chart covers the period since the Base Low, i.e., the full Bull Market Rally so far.

1.  The Up Kahunas with a count of 12 to 9 are a few more than the Down, and is reasonable since the bias is up.

2.  When the market corrected in June/July by about 9%, we had three shots across the bow where I note that we dodged a bullet

3.  Also take note of the two Kahunas essentially within three days on two occasions in the second leg up of this rally which assured the direction would remain up.  The Bears did not have the support either back in July or in these last few days to assert their authority and drive the market down.  The overall sentiment is still up for now.  It will not change until Wall Street Bonuses give way to Jobs, Jobs, Jobs as the hue and cry!

I say learn from those signs and when we see the reverse happen get ready to run for the hills as it will be one of the earliest clues we will see that things have reversed and that the Bulls have no further answer up their sleeve to thwart a Bear assault.  But that in itself will not be enough, so let’s look at the next chart which shows the roadmap signs of what to expect:

crash

There are six points to be made from this chart as to what to look for given a Correction:

1.  The first clue will be at least two if not three unanswered Kahunas to the Downside in quick succession as mentioned above.

2.  Although late, probably the best clue that things are going wrong is a Bongo Weekly Red

3.  Prior to that the HGSI Indicator scores will be at least -4 and trending to -6 or more

4.  The %B will have rapidly descended and will stay below the Bandwidth

5.  The Correction on the Major Indexes will be > -8%

6.  The Kahunas will oscillate back & forth between Blue and Red, indicating Bulls and Bears are fighting for control.

chaikin

Finally, the above chart of Chaikin’s Money Flow is looking a trifle precarious and needs to show a lot more strength.

I’m not saying this will happen, but anticipating what must occur provides an “On Guard Plan”. 

We shall see how all of this unfolds down the road.

Best Regards, Ian.

An Early Stock Market Gift From Santa

Monday, November 16th, 2009

Last week I told you that the Santa Claus Rally would come early this year, and true to form he is as proud as a Peacock as he drops in with some goodies for all of us:

santa

Having recovered from getting the Newsletter posted yesterday, I offer two brand new Leaders Indexes as a Santa Gift to you and trust they will serve you well in the weeks to come.  One is an updated RonIandex from the work we did at the seminar which now replaces the tired and worn out 06152009 Gorilla Mkt Leaders which has served its purpose very well.  The other is a brand new idea which builds on the work that Ron has developed to make use of the Force Index and Total Dollar Volume Combo Rank we provided in the Newsletter of yesterday.

Twenty years ago when I first introduced the concept of the Ian Index, with a name change 15 years back to Iandex, and then ten years ago to the RonIandex when Ron and I teamed up, we have successfully provided you with a set of about 20 to 25 leaders at critical points in time.  These Indexes have paid their dues time and time again in two ways:

1.  The primary purpose was to provide an early warning of when the Stock Market Indexes might correct. 

2.  Since no one can identify exactly when the market will top, many of the stocks on the list provide a winky-winky to do your homework for additional profitable gains until they do break down and correct.  Look for pullbacks in these Gorillas and hop on for the ride.

The underlying principle of the RonIandex is based on the axiom “The higher they rise, the faster they fall”.  It is an Aggressive Growth Stock Index aimed at identifying tops, as well as a snapback after a correction.  At minimum it can be classed as a Minor Correction of <8% on the S&P 500 and about 10% on the Nasdaq.   Most often when a rally has been as long as nine months, the correction can be at least an Intermediate Correction of between 12 to 16% for the Nasdaq.

The intent of the RonIandex is to select those stocks that are the leaders in leading HGS Groups once the Nasdaq breaks out into new high territory and at this time is >18% above the 200 Day MA.  It did that on 9/23 when the Nasdaq peaked at nearly 27% above its 200-dma High Jump.  It then slipped back under heavy profit taking and just as quickly snapped back up. 

That shows that buying on dips is once again in vogue, so now is the time to identify those leading, and usually very extended, stocks that will give us an early warning sign, hopefully before the Market curls over and corrects once again. 

The logic is that since these stocks are fat with profits and are in leading groups with High ERG and strong Rel Str Rank, they will get hit hardest when the market corrects.   The primary purpose of the RonIandex is to show that it is breaking key support points such as the 9 Day MA, 17 Day MA and ultimately the 50 Day MA, if the correction is MORE THAN MINOR.  So the secondary purpose is to identify the best of the best 20 to 25 stocks in 15 or more leading groups that will provide a steady climb based on their behavior the past few months.  However, to all NEWBIES my strongest warning is don’t play with dynamite until you know how to handle it  – you can get eaten alive if you go in blindly and buy these stocks and the market turns sour on you.

With all of that as background, here is the chart which compares the 06152009 Gorilla Mkt Index with the two new indexes and the Nasdaq to give you some idea of the relative strength of these Indexes when measured from the Base Low in March 2009.  The stocks that make up the Indexes are shown below the chart for your convenience:
chart

If you stare at the chart, here are some pointers for you:

1.  Note how the 06152009 Gorilla Mkt Leaders Index is nearly twice the strength of the Nasdaq.  Being of stalwart make-up, it matched the fresh RonIandex of 11142009, until it tailed off in strength in mid September, and is now essentially flat, indicating it has served its purpose. However, it still has life in it as it surged 1.57% today and is up over 33% since 6/15/09, when I first introduced it to you.

2.  The 11142009 RonIandex is made up of a few old warriors and several new leaders which are showing their muscle, now that the EARNINGS REPORTS are behind them.  There is nothing worse than selecting stocks for such Indexes that haven’t announced their earnings.  The whole purpose is to time the selection of such Indexes after the bulk of the Earnings Season, so that one can quickly identify NEW Leadership.  This Index is up 1.42% at the close today.

3.  Albeit, we are too quick to paint this rally as “Junk off the Bottom”, but I learned many moons ago that the fresh new companies that are coming out of the woodwork which I call Box 7 stocks with >100% earnings the last two quarters is the best kept secret HGS Users have known for Years.  So fresh off the drawing boards, I built on Ron’s portion of the newsletter to give you the “New Demand Leaders” which has a mixture of up and coming new leaders and “tiddlers”, so that there is something in there for everybody to taste.  Naturally, its Index is “To Da Moon” with a reading of 345%, over five times the Nasdaq!  If you don’t work with stocks below $15 just overlook them, but there is a smattering of six tiddlers in this Index.  This Index is up 2.26% at the close.

4.  Just one glance at the steep rise in % Change in mid-July, and again confirmed two weeks ago from early November, should leave no doubt that these stocks are worth reviewing and selecting and discarding as one sees fit according to your fancy.  Note the surge in Volume on those two occasions. Also note the Dark Green ribbon, third from the top, which confirms heavy accumulation of the stocks in this Index now. 

Those of you who attended the seminar need to dust off HGS 1001 and review Pages 179 to 181 to prepare yourself for the next targets for the S&P 500 and Nasdaq…now that 2206 is within the Nasdaq’s sites.  Don’t forget there is still a residual “White Swan” volume vacuum, particularly for the S&P 500.

Yes, of course there will be Moose Droppings along the way, but Santa is enjoying the sleigh ride early this year.

Best Regards, Ian.

Seven Weeks Away From the New Year

Sunday, November 8th, 2009

Time flies when you are having fun and who would have thought that we are just seven weeks away from the New Year.  I don’t show themes about Santa Claus Rallies this early, but as you will see there is a method in my madness and I assure you I have not taken leave of my senses.  So with that in mind, I offer you that during this next several weeks there will be much talk about Santa, the Grinch & Moose Droppings along the way:

        santa

I have taught you not to fall in love with one theme for which way the Market will go…it is fatal to do that and I have mentioned enough times that now is the time to have light feet and stay nimble.  That said, for the benefit of those who may be passers-by, here is what I espouse and follow faithfully.

 three

At the Seminar we held two weeks ago, I gave my friends the balanced review of the internals of the market and which way the wind was blowing for each Camp and I would like to share it with all of you.  Please note that only three days ago I came out with a blog note that said the Internals had gone to “Pot” and showed you why.

Here in quick succession are three slides I used (suitably updated where necessary) which lays out the case for Camp Sunshine and Camp Gloom and Doom, and poses the question “When will we know this Powerful Rally is over?”

The Case for the Bulls:

bulls

The Case for the Bears:

bears

When will we know this phase is over?

phase

As I digest the various discussions on the bb’s I frequent, there are excellent reviews of what will give confidence that this is or is not a Bull or a Bear Trap, depending on which side of the fence one is on.  The eye opener for me is what transpired on Friday with the jobs report as I highlighted in red on the above slide.  So I offer you the following slide which may just shed light on what the Composite Man’s goals are in the next seven weeks and why I felt I should give you an early heads-up on the Santa Claus Rally and January Effect phenomenon:

bonus

We shall see how this plays out. 

Best Regards, Ian.

Copyright © 2007-2010 Ian Woodward
Disclaimer: Commentaries on this Blog are not to be construed as recommendations to buy or sell the market and/or specific securites. The consumer of the information is responsible for their own investment decisions.