Ian Woodward's Investing Blog

Archive for October, 2012

Stock Market: Bears are Dancing Again

Sunday, October 21st, 2012

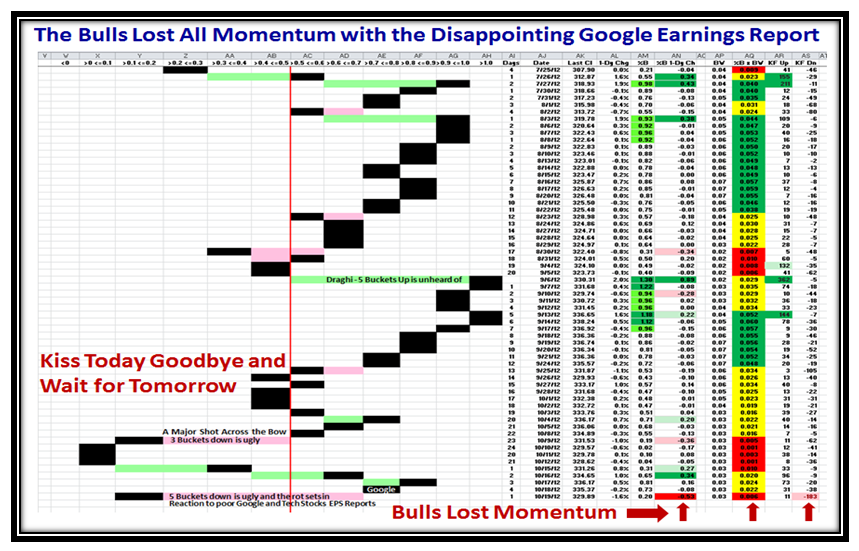
I see the Tom-Toms are beating loudest again in Thailand and my good friends in Qatar looking for more information after the Major Five Bucket Down Day we had on Friday which took a Bite out of GOOG for a disappointing Earnings Report among others such as IBM and McDonalds.  Net-net we are back in the doldrums and the Bears are in Control for the moment.  Next week is critical to see whether we have a Bounce Play or trot on down further to test the mighty important line in the sand of the -8% Mark on all Indexes from their recent Highs.

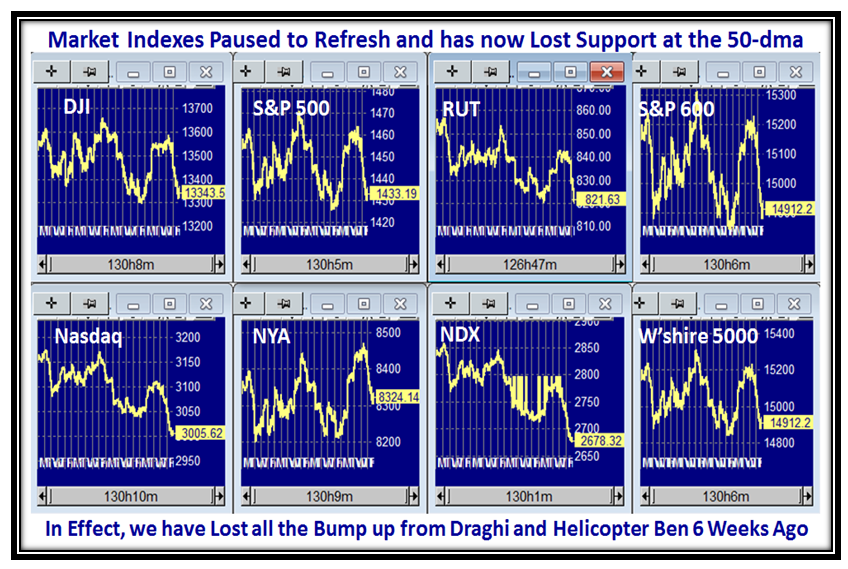
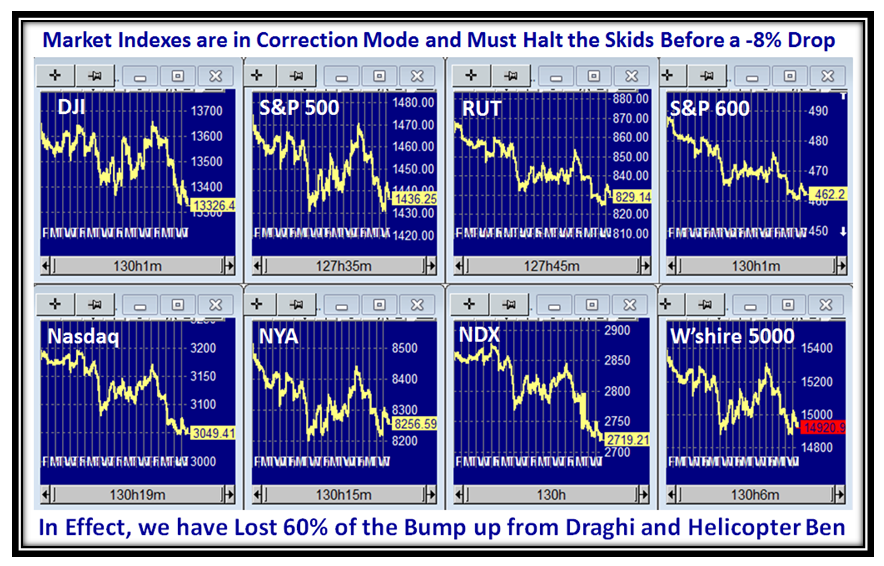
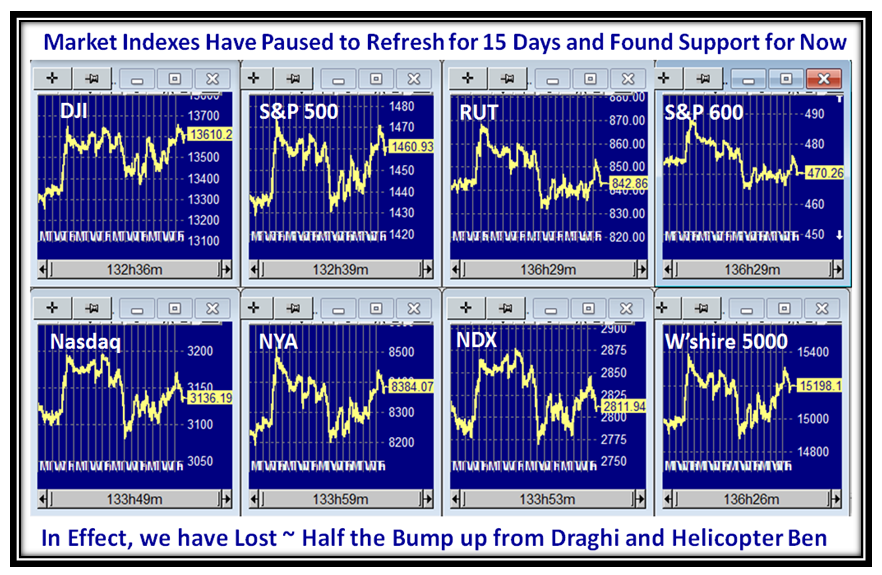
Here is the usual picture I give you of the Market Indexes which are all droopy:

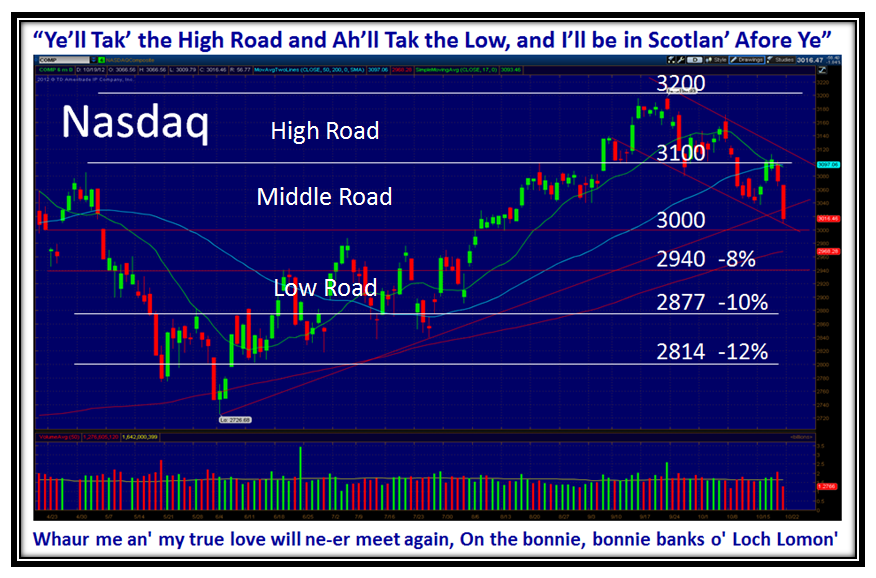
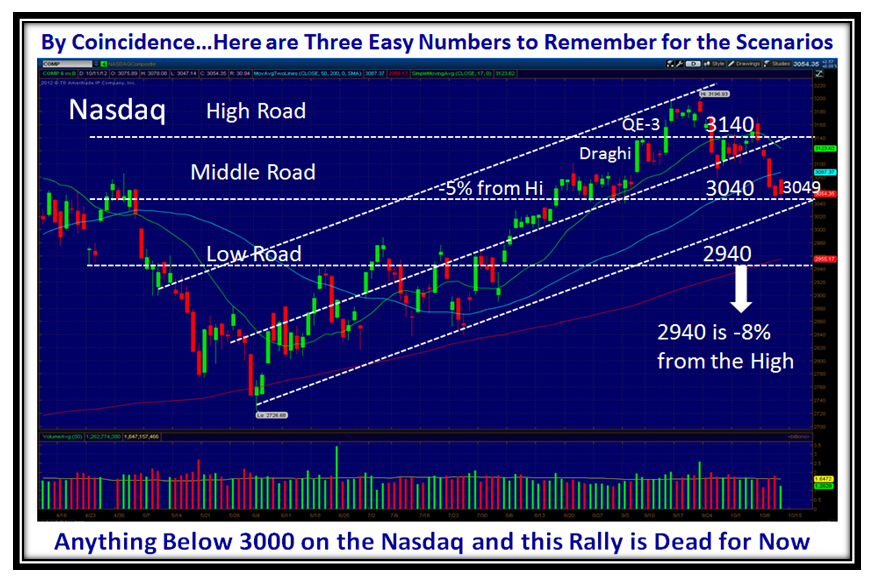
…And here is the Roadmap for the High, Middle and Low Road Scenarios while doing a Highland Fling for my good friend Mike MacDonald:

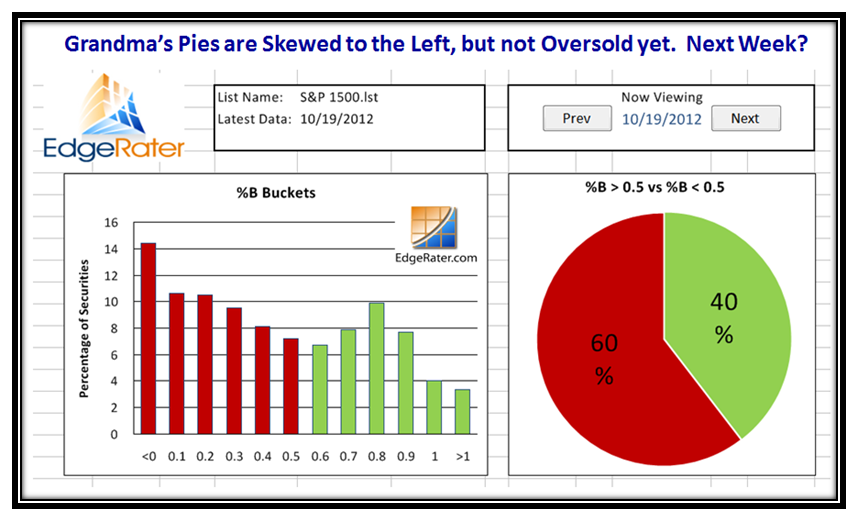
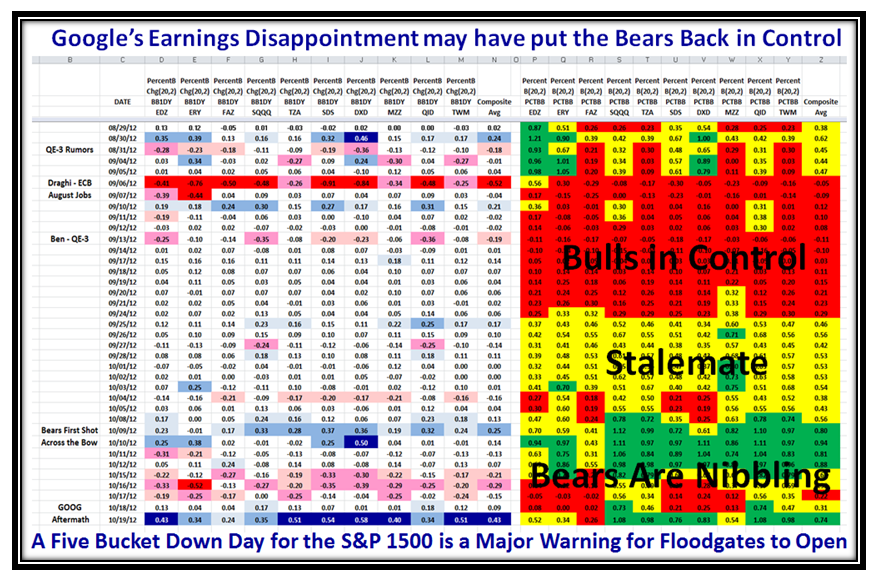
In a matter of one month, we have moved from Irrational Exuberance being overbought from the euphoria of Draghi and Q-E 3 to being down in the dumps through the phase of Stalemate as you will see from these various charts:

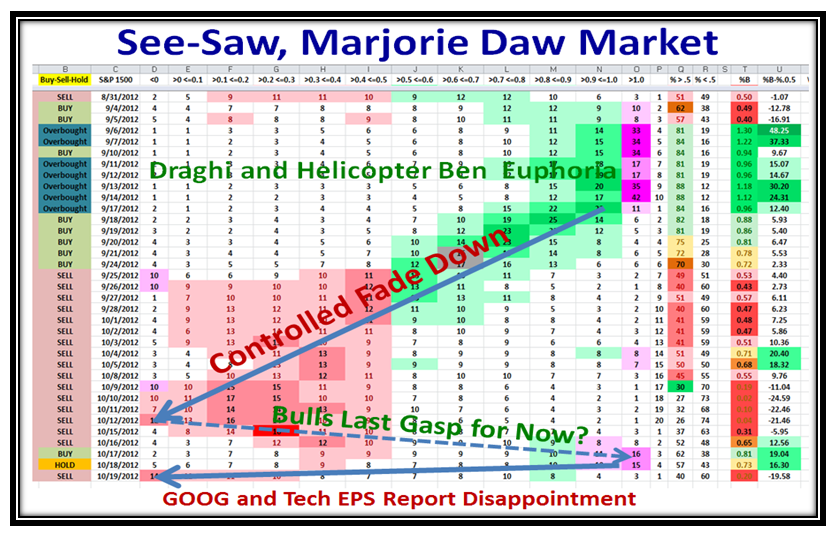
…And here’s the See-Saw, Marjorie Daw Picture:

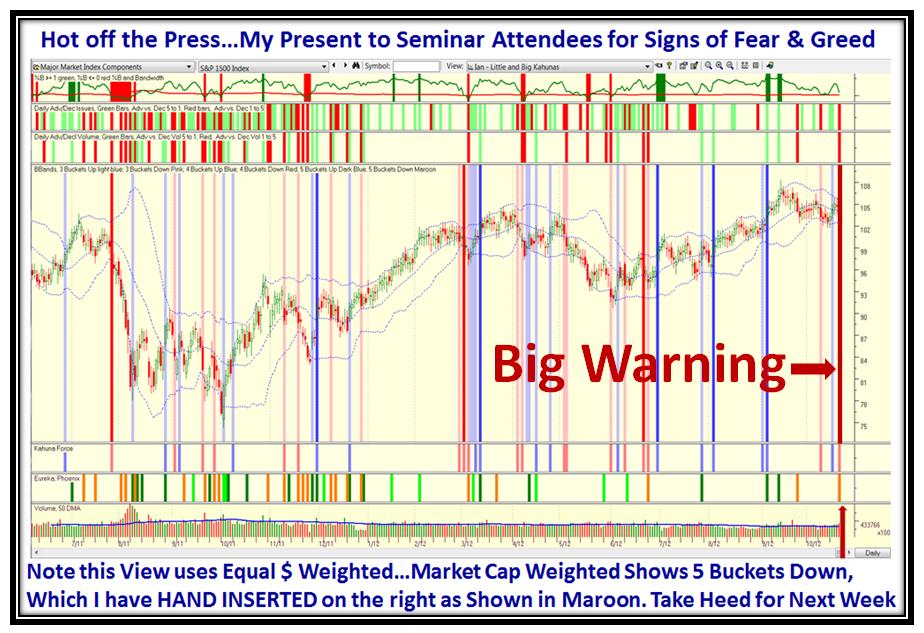
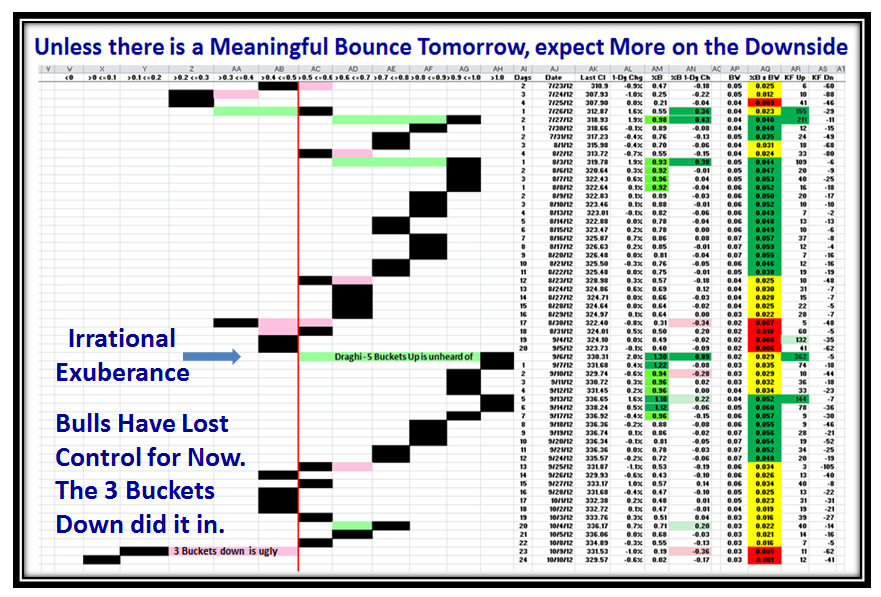
Here is that Five Bucket Down Warning I gave you.  It may snap back or it can drag you down next week:

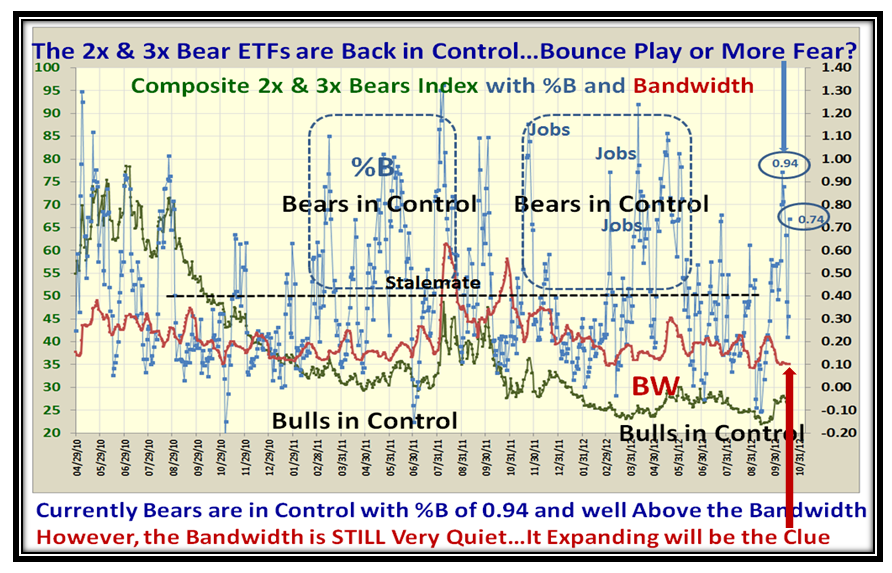
You folks who are into this stuff with a vengeance are already on top of the 2x & 3x Bears Picture which looks ominous:

…And here is the twin picture.  There is some hope for the Bulls as the BANDWIDTH is still quiet, and if things break to the downside, this will be the first clue as it will jump up fast.

Well, we are down to the last week before the Seminar and we will be well into it this time a week from now.  As a sneak preview for the people who will be attending Bob Meagher helped me develop this next slide which we will cover at the seminar.  It shows the history of 3, 4, and 5 Bucket skips either up or down and gives ample warning of Fear, Hope and Greed.  The bottom line is that next week is nail biting time and it may turn out to be a fizzle, and then again your job is to preserve your nest egg…which is what I have taught you for these past twenty years!

Best Regards and thanks for all your support,

Ian.

Stock Market: Late Breaking News

Sunday, October 14th, 2012

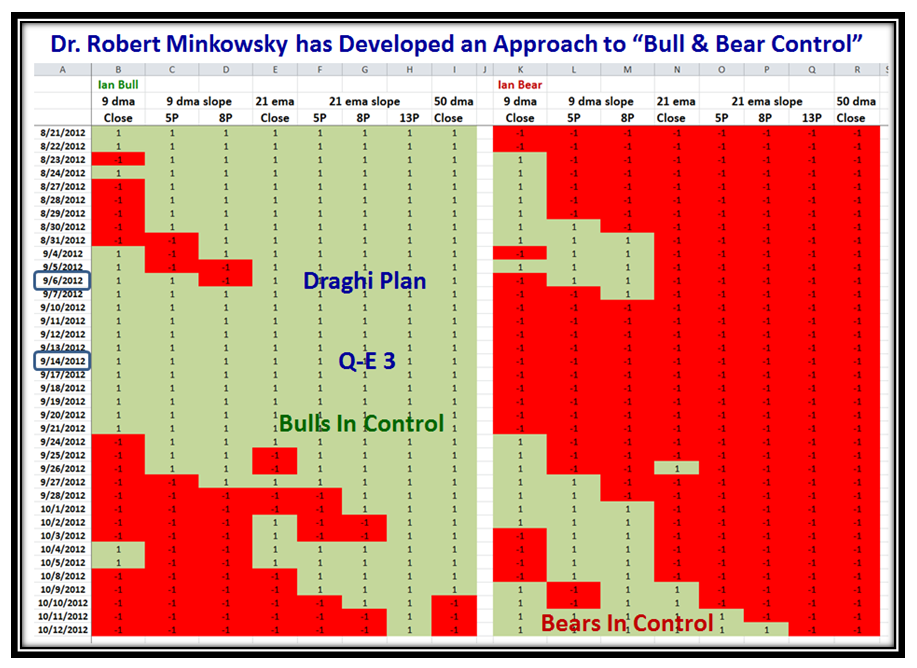
My good friend, Dr. Robert Minkowsky whom I have known from the days of wine and roses back in 1994 when I first gave a seminar for Telescan in San Francisco has built on the 2x & 3x Bull and Bear Set of ETFs we use in EdgeRater to know who has control.  He is a big believer in “slope analysis” to give an early feel for which way the wind is blowing and has presented his findings in a simple depiction which gives you the feel in an instant:

Best Regards,

Ian.

Stock Market: HGSI Monthly Newsletter Overview

Saturday, October 13th, 2012

Overview:

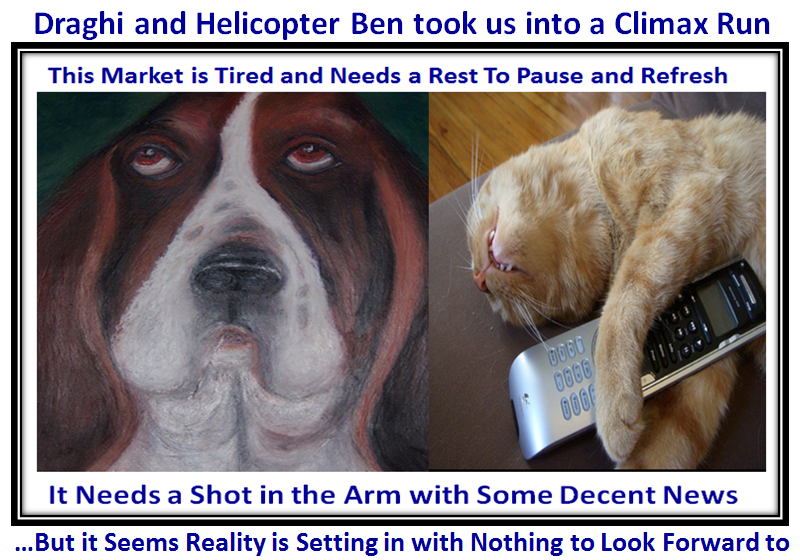
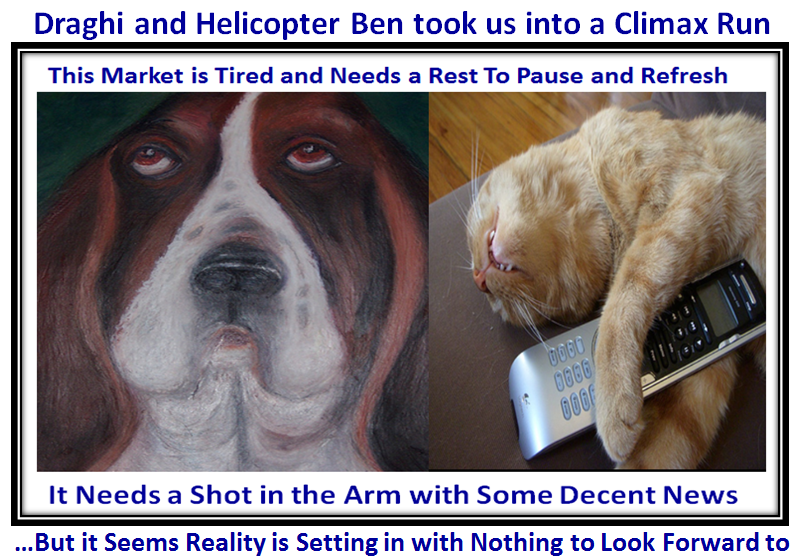
This Month’s Picture suggests that the Bulls are tired now that the irrational exuberance from both Draghi and Helicopter Ben doing their bit to lift the markets took them into a climax run.  With the market down six days in a row…fortunately on light volume indicating that the floodgates of Fear have not yet opened, we sit and wait for fresh news to either take us down to -8% from the highs or halt the rot that is slowly setting in.

Besides discussing the High and Low Road Scenarios, my theme for this month is to give you a logical explanation with three signs for when the Jobs Report numbers in 2013 will determine whether the economy has at last turned around.  I also show the downside targets so that you have a clear perspective and warning ahead of time to protect your nest egg.

Ron will devote his piece to Pocket Pivots, as those attending the Seminar will enjoy seeing Gil Morales in the flesh!   Hurry, Hurry, Hurry. The Round Table discussion is on Wednesday, 17th October at 4.30pm EST, where we will as usual expand on the ideas in the newsletter.

We look forward to seeing you at the Seminar on October 27 to 29 at the Palos Verdes Library and as always we will have fresh material to cover as we again raise the bar.  We have Gil Morales and possibly Chris Kacher as speakers along with Jeffrey Scott and Chris White.

Ron and I look forward to seeing you all in two weeks to the day.

Best Regards,

Ian.

Stock Market: Tired and Needs a Pause to Refresh

Thursday, October 11th, 2012

After the reaction to the Draghi Plan on Sept. 6th., and followed by Q-E 3 from Helicopter Ben on Sept 14, the market essentially shot up into a Climax Run and the Nasdaq topped out at 3196.93.  Now it is evident that we have more than “Paused to Refresh” as a result of the last five days action:

The Market Indexes look a trifle ugly today as shown below, and we have lost all of 60% of the Bump Up from those two events:

That stake in the ground of 3196.93 helps to establish the measuring rod of -8% down to take us to 2940 from the high, which if broken sets us on the Low Road Scenario.  If you have followed this blog, you know full well that 70% of past corrections have turned up again at -8%, but heaven help you if it goes down further as it can land anywhere!  We are fortunate that we have three numbers 100 points apart that by co-incidence separate the High, Middle and Low Road Scenarios at critical support and trend line points:

With tomorrow being the end of the week, the Market needs to produce a meaningful Bounce Play to arrest the current rot that has set in albeit with no flood gates open as yet in terms of down volume, or we should logically expect more on the downside next week.  The three buckets down on October 9th. took the wind out of the Bulls’ sails and we are now wallowing around in the doldrums:

Be careful at this stage unless you enjoy the Volatility and can turn on a dime.

Best Regards,

Ian.

Stock Market: Beauty is in the Eye of the Beholder

Sunday, October 7th, 2012

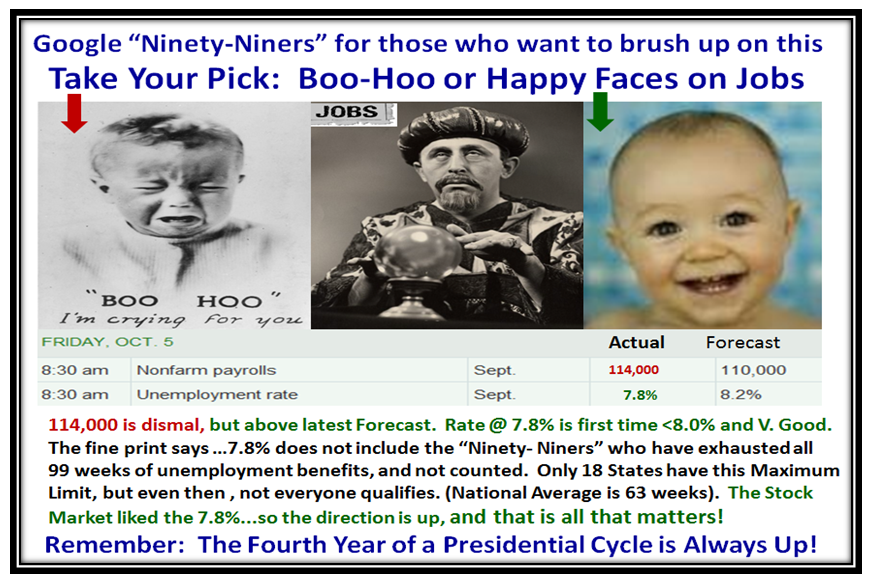
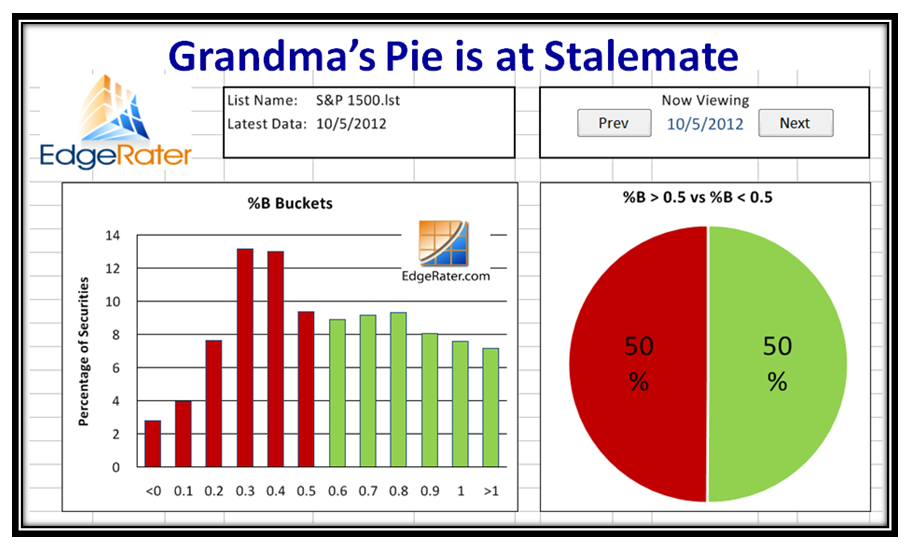
The Jobs Report was mediocre to say the least by any past standards, but the Stock Market was very impressed with the 0.4% drop in the Unemployment Rate which carried the overall number to 7.8% for the first time and below the 8.2% the previous month.  The market shot up early on, but gave back most of its gains at the close to leave the S&P 1500 exactly at Stalemate, with a 50%:50% above and below %B at 0.5…the Middle Bollinger Band.

So, we come to the chart which you are now very familiar with.  As I cautioned last month, August and September are traditionally low, and I set the expected bar at 133,000 jobs to suggest any signs of true economic recovery in the near term.  It seems that is not to be, and further more was not important at this stage of affairs where the Unemploment Rate of 7.8% took center stage.  It is the Market Reaction to news that matters, and that was very favorable to start the day on Friday, but petered out by the close.  As I understand it, there are two items which account for the surprise of a 0.4% drop in the Unemployment Rate:

1.  The Ninety-Niners as I mention above, which are not counted in the Jobs Report

2.  The sloshing back and forth of Part Time workers included in the Jobs Report, which can affect the number due to seasonality

In the short term be thankful that we dodged a bullet, and as I have reminded you many times before the market invariably stays strong through the 4th. Year of a Presidential Cycle.

The Market Indexes have Paused to Refresh for the last 15 days and some such as the DJI and S&P 500 have recovered from being down 2 to 3%, while the rest are still catching up.

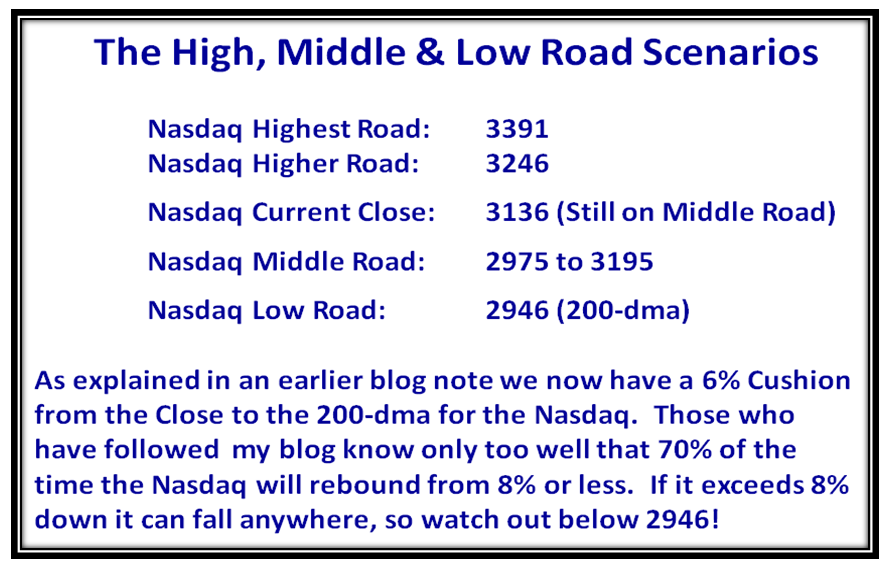
The net of all of this is that we are at Stalemate, and on the Middle Road or Marking Time Scenario as shown below:

…And to confirm we are at Stalemate, Grandma slices the Pie right down the Middle!

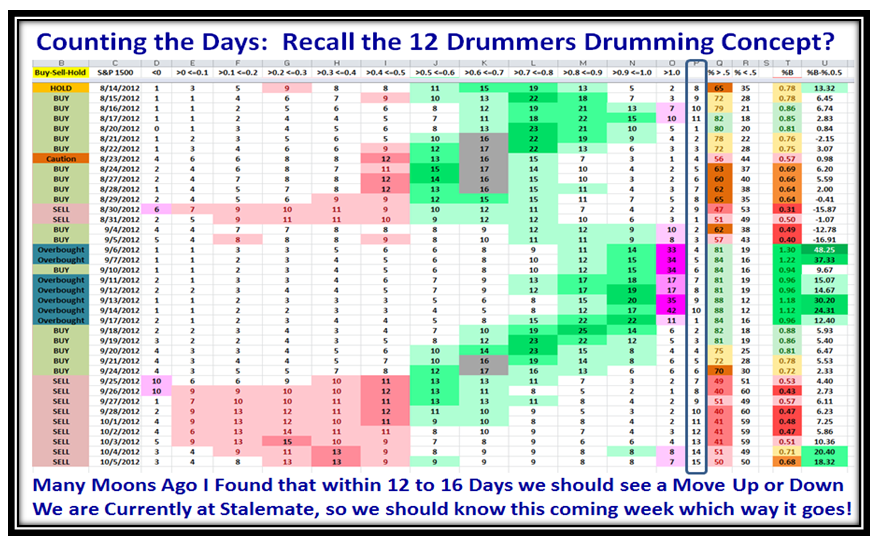
So what, say you?  Turn to the 12 Drummers Drumming Concept which I introduced many moons ago when I found that after the S&P 1500 has hit a Large % in Bucket >1.0, in this case 42% as shown on the next chart, it is time to start counting.  Invariably within 12 to 16 days the Market heads down, and the Bears are favored.  This time we have dawdled around at Stalemate for all of nine days if you look down column “Q”.

However, if we now look at Column “T” which gives us the entire %B for the S&P 1500 we see that in the last two days we have respectable readings of 0.71 and 0.68 implying that the stocks above the Middle Bollinger Band are holding strong.  Now cast your beady eyes on Column “O” and we see an unusual bit of “pink” at 8% and 7%, which suggests that those cells are up one Std. Dev. from the norm and therefore strong.  Net-net it is a tough call and next week will tell us whether the Market wind is at our backs or in our faces:

So for now we sit at the Middle Road Scenario and the numbers for the Nasdaq are as follows:

Have a Happy!

Ian.

Copyright © 2007-2010 Ian Woodward
Disclaimer: Commentaries on this Blog are not to be construed as recommendations to buy or sell the market and/or specific securites. The consumer of the information is responsible for their own investment decisions.