Ian Woodward's Investing Blog

Author Archive

As the World Turns – Global Markets Perspective

Tuesday, November 27th, 2007

World Turns

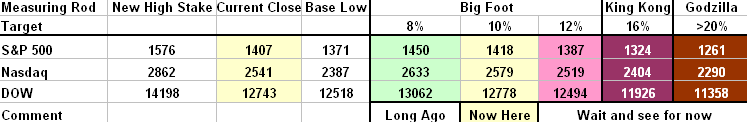
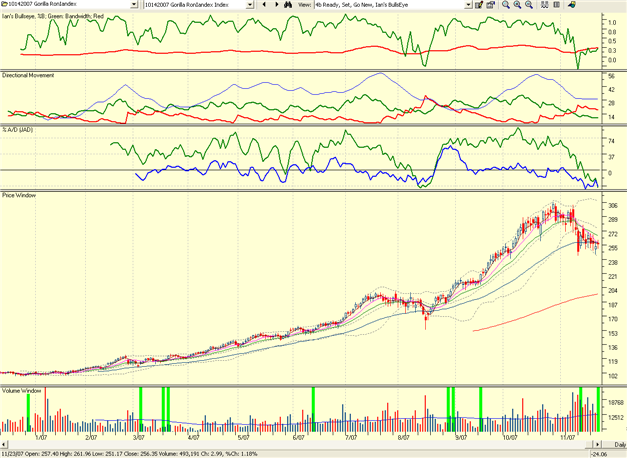
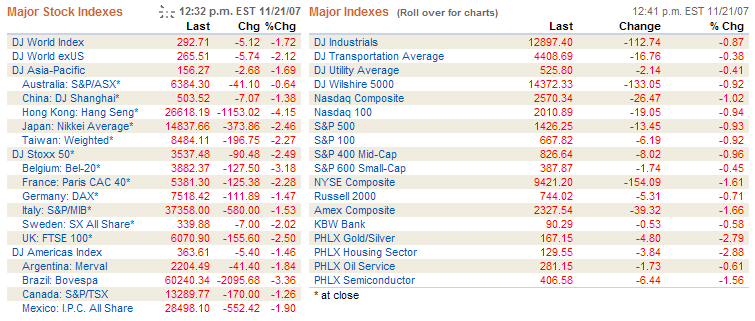
By way of a change, I felt it might be worthwhile to show where the US Markets sit in their corrections relative to the World Markets to get some perspective of the extent of the corrections worldwide.  In addition, on the right hand side of the chart below I show the S&P 500 Corrections greater than 8% since 1980.  You can see that the U.S. market sits in the middle of the pack and again in the middle of the range of corrections given that we had a bounce today and are currently sitting at 9% down from the high and for the month…between friends.

Perspective

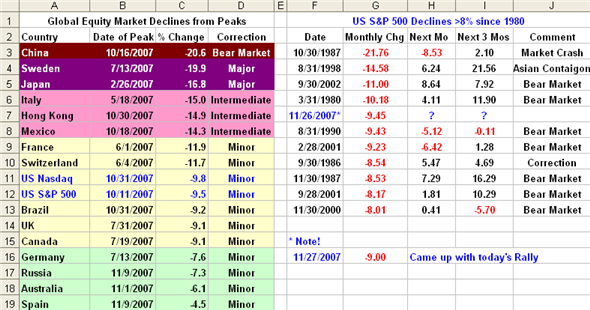
  1. Note that although China has had a huge gain this year, it has already dropped over 20% from its high and is therefore in a Bear Market.  Likewise, Sweden and Japan are knocking on the door with a Major Correction.  I have used the same color code as in other notes so you can peruse the rest of the world easily as to their correction status.  As we can see, most corrections greater than 8% in one month relate to a bear market where most corrections occur together with the dreaded “R” word…a recession.  Goldman Sachs put the chances at 40 to 45%. 
  2. It goes without saying that there are two schools of thought on what the Fed should do in their Middle of December meeting.  Those who believe that the last shoe has not dropped yet on the Credit Crunch and Housing problems believe a further shot in the arm of a reduction of 50 basis points is what the doctor ordered.  Others feel that any further rate cuts can cause a further run on the weak dollar, that the cost of living is ever increasing and that gas and food are the main criteria that measures how the masses are suffering at the lower end of the income scale.  As my blog of three weeks ago on November 8th indicated the FOMC is caught between a rock and a hard place. 
  3. All is not gloom and doom.  Today looked like we were due for more on the downside, but up strides the Sheiks from Abu Dhabi to provide a $7 Billion injection to Citigroup…mind you at a hefty 15% rate…if my understanding is correct.  That caused the big bounce at the onset, and then we had the usual late fade about two hours before the close.  It looked like the party for today was over as one could hardly not notice that many were selling into the bounce.  For the first time in ages when there has been a late sell off near the close, the market came back to finish up 215 points on the DOW, nearly 40 points on the Nasdaq and 21 points on the S&P 500, all over 1.5% gain from yesterday.   
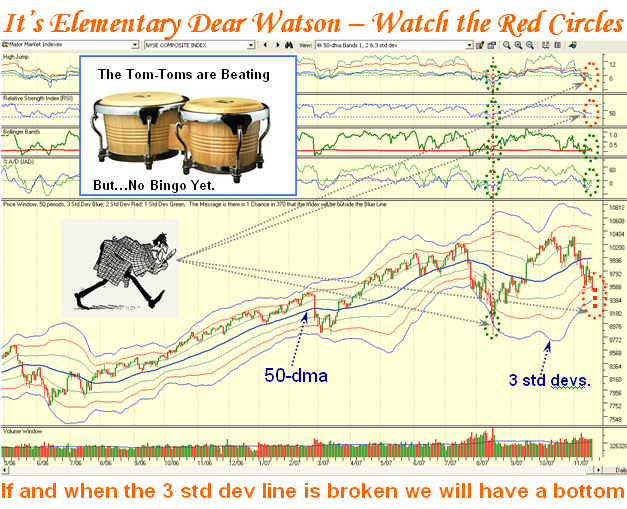
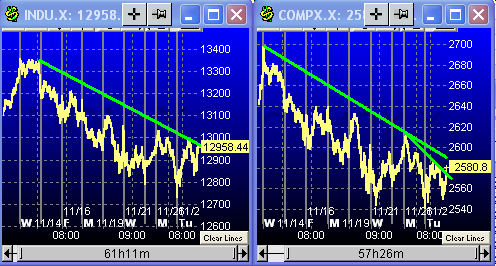
  4. That’s the good news.  Now the bad news is that the DOW and all the other Indexes are on a sell signal. The DOW needs to close above 13100 or higher to reverse the last dip into the lows and could trigger a year-end rally attempt.  Likewise, the Nasdaq needs to get above 2640.  However, we need another 1000 points up to reverse the sell signal on the DOW.  This implies a 10% bounce play and that is wishful thinking at this stage of events and would be reserved for a major new set of news for such a change to occur.  The thumb nail charts for the DOW and Nasdaq are shown below for the past week.  We have lost a lot of ground as we can see:

          Dow

Best Regards, Ian.

Strong Black Friday was Wishful Thinking for the Market

Monday, November 26th, 2007

         wishful

Right on queue, the Stock Market opened up this morning but then the gloom and doom set in with the Credit Crunch problem once again looming high on the list and taking center stage.  The net expectation for a decent rally was obliterated within an hour, if that and the DOW finished down a healthy 237 points or -1.83% and the Nasdaq down 55.61 and -2.14%.  Big Foot is back at over the -10% correction level, and with the Ten Year Bond now below 4% at 3.87% the Market is running scared.  There is little point in my belaboring the point, but this does not bode well for a decent Santa Claus Rally.  Here are the amended numbers for the Stakes in the Ground:

chart

We are knocking on the door of a 12% correction and it won’t take but one more bad day to get down to that level.  Nimble day traders are the only ones to make a “buck” in this market, and the VIX shows the high Volatility with a reading of 28.91.  Keep your powder dry and stay in your foxhole is the message for swing traders and intermediate term buy and hold types or stay short with ETFs of QIDs and FXPs. 

Best Regards, Ian.

The Santa Claus Rally is in the Balance

Sunday, November 25th, 2007

santa

The Bargain Hunters were out in full force on Friday both in the Shopping Malls and in the Stock Market.  The nation’s retailers had a robust start to the holiday shopping season, according to results announced Saturday by a national research group that tracks sales at retail outlets across the country.  According to ShopperTrak RCT Corp., which tracks sales at more than 50,000 retail outlets, total sales rose 8.3 percent to about $10.3 billion on Friday, the day after Thanksgiving, compared with $9.5 billion on the same day a year ago.  ShopperTrak had expected an increase of no more than 4 percent to 5 percent. 

In the Stock Market the Index gains were impressive but as usual it was primarily bargain hunters on very light volume.  The Eureka Signal we got indicating an unusually strong day must be discounted as such signals at holiday time are usually meaningless.  None-the-less after a brutal three weeks where the Nasdaq lost over 11%, the respite on Friday was a welcome fillip to those who were looking for a decent bounce day with an oversold market.  The big question is whether the Financial Media will hype the Strong Black Friday Retail results sufficiently to propel the Nasdaq back above the 17-dma and 50-dma above the 2680 mark…a gain of 100 points from its current 200-dma line.  The big leaders such as GOOG, AAPL, RIMM and BIDU have either found a base at their 50-dma or have bounced up off it.  However, GRMN is a casualty in this correction, and the others, especially BIDU, are looking vulnerable should the Santa Claus Rally not materialize as they are all sitting waiting for the bears to pounce with any signs of weakness in the Indexes.  It goes without saying that the likes of the Transportation – Shipping group has been pummeled with DRYS and EXM down 44 and 51% respectively. 

The summation of all of this can be seen by looking at the Gorilla RonIandex, which was put together 6 weeks ago on 10/14/2007.  It is right at the 50-dma and can go either way, with the odds suggesting downwards, UNLESS there is a dramatic change in sentiment and a drive to move the stock market up for the December rally.  Net-net, the Short term direction is down, but the intermediate and long term direction is still up, though the intermediate term is hanging on by a thread!

roniandex 

It will be interesting to see how the next month plays out as the litany of problems in favor of the bears need not be listed as they are well chewed over, and the case for the Bulls are based more on folklore and hope than anything solid.  Appreciate that the EPS guidance for the 4th qtr has also been lowered since we visited the pros and cons so that too is a damper for the Bulls.  It is worth reciting the thin thread the Bulls have for posterity sake: 

  1. The Retail Stores report for this past Friday gives an uplift to an oversold market
  2. The Fund Managers have a vested interest in their Year End bonuses being propped up
  3. Our friends at the FOMC pull another rabbit out of the hat with yet another drop in rates 

This year will be especially good for the 350,000 or so who work in the City. Bonuses this year are expected to reach £8.8bn, with stock markets trading at five-year highs, a raft of mergers and acquisitions and competition for top executives. 

That last thought in item #3 would really show the FOMC’s hand in making sure that the market stays up at all costs despite the serious threat of a run on the already weakened dollar and further increases in oil prices to over the $100 mark. It’s a given this is a day-trader and very nimble swing trader’s market, as the intra-day swings on the DOW are routinely well over 100 points and invariably as much as 200!  Best regards, Ian. 


Have a Happy Thanksgiving Everyone!

Wednesday, November 21st, 2007

Thanksgiving

 The Market Correction underway is Global by the looks of things.  As David Schoon reminds me “with China down >1%, Tokyo down >2%, Taiwan down >2%, Korea down >3% and India down >4%, we’ll find out today how much pep the bulls Stateside have before eating their turkeys!”  Here’s a snapshot just before I go out to do a “honey do” to get the Turkey!  We can see that the Indexes are all blood red as I write this at 10.00 am PCT:  

Indexes

There is little more for me to say but to wish you all a Very Happy Thanksgiving and I thank you for all your support, encouragement, feedback and friendship.  Best Regards, Ian.

The $64,000 Question – When will we find a Bottom?

Monday, November 19th, 2007

You can see that we still need three “Dotted Red Ovals to turn to Green”, before we have a chance of seeing a Bottom.  Note that I did not say “THE Bottom”.  However we are getting more and more into oversold territory and unless we have a major melt down due to some surprise news, we do not have far to go to find a bottom for a Bounce Play.  The one we had with a 300 point up day and a Eureka signal fizzled, so maybe once we get the stars to line up as shown by my friend Sherlock Holmes we will see a Bounce.

bottom

It requires three things to happen:

  1. We need the NYSE Index to break the 3 Std. Dev. Line convincingly as shown at the bottom.
  2. Simultaneously we must have RSI 14 Periods come down to 30 or lower.
  3. We need Capitulation where the New Lows for the day are around 1000 on the NYSE

At that point the Bongo drums should be beating out “Bingo”.  We shall see.  For those of you who have the HGSI Software and have downloaded the latest charts, make sure to go to Major Market Indexes, Select the NYSE Composite and the 4K 50-dma Bands 1, 2, 3 std. dev chart. Best Regards, Ian.  

P.S. Don’t all shout at once…I modified that view to include the %A/D.  The red oval at the top was an additional item to watch which is to see if the Limbo Bar comes down at least -5% from the 50-dma for good measure.


Copyright © 2007-2010 Ian Woodward
Disclaimer: Commentaries on this Blog are not to be construed as recommendations to buy or sell the market and/or specific securites. The consumer of the information is responsible for their own investment decisions.