Ian Woodward's Investing Blog

Archive for the ‘HGS Principles’ Category

Stock Market: Marking Time for Jobs Report

Tuesday, October 2nd, 2012

Well done Europe on winning the Ryder Cup.  Let’s hope the Friday Jobs Report doesn’t turn out to be another Boo Hoo!

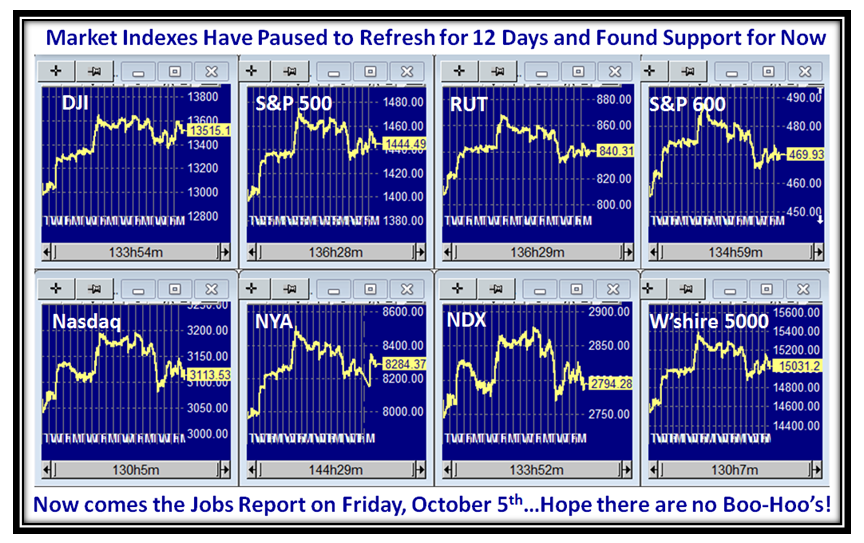
The Market Indexes have fallen back as predicted, but Friday remains the big hurdle with the Jobs Report:

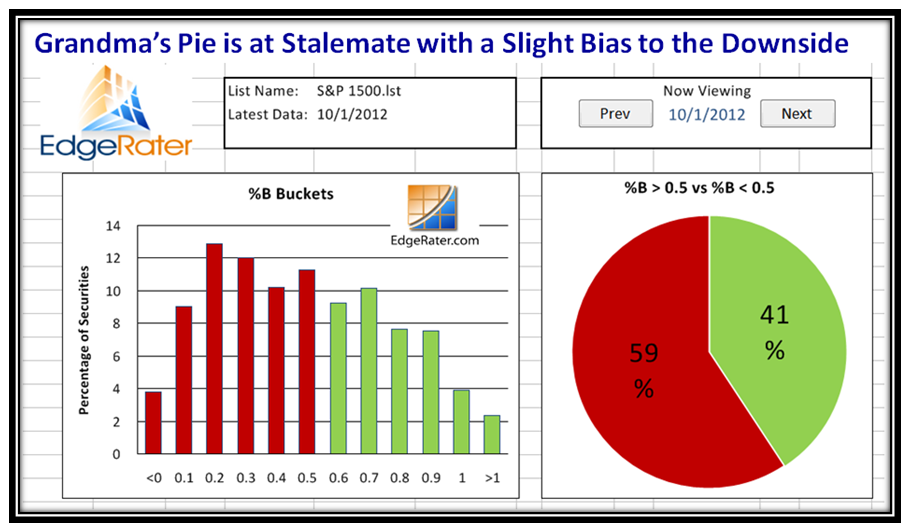
The markets are essentially at Stalemate, with a slight bias towards downwards:

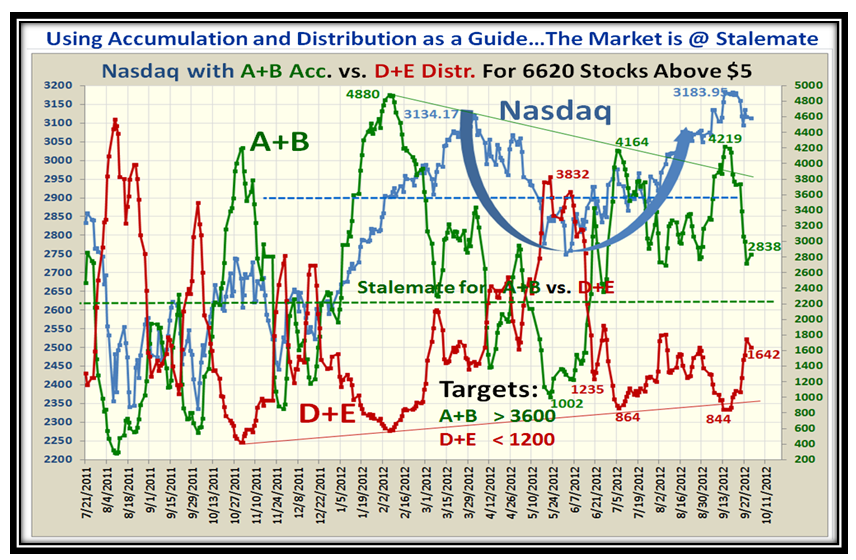
Accumulation/Distribution is slightly better but not much than Stalemate…A healthy Market is a 3:1 Ratio between A+B/D+E:

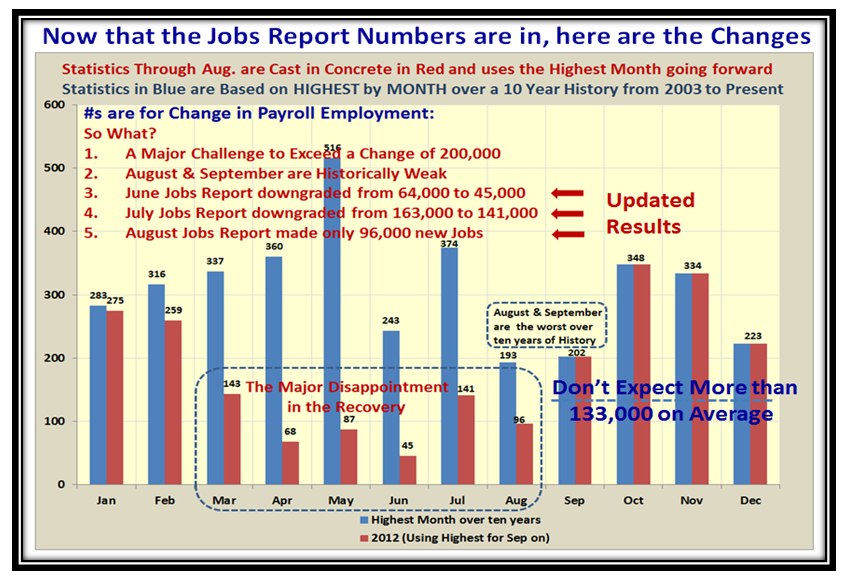
Not much news in a dreary market, so let me leave you with the picture for the Jobs Report to come on Friday:

Less than a Month to go to the Seminar, so if you plan to come get cracking and sign up.

Best Regards,

Ian.

Stock Market: Back to Stalemate!

Friday, September 28th, 2012

You need to be a “Real Cowboy” to Trade in this Market!  With the Ryder Cup morning session tied at 2:2, let’s see if I can give you the heads-up going into the weekend on what I see for the coming week.

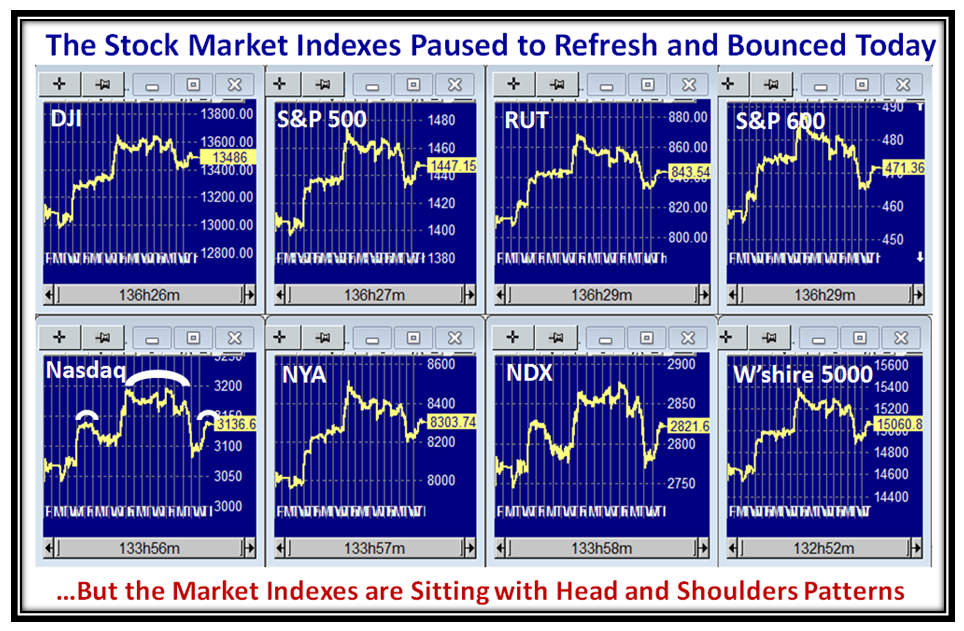
We got the expected bounce play Yesterday right on the ninth day as in previous cases, so who says “History Doesn’t Repeat Itself”?  With today’s action wishy-washy with two hours to go, the Indexes are showing a Head and Shoulders Top Pattern, which is not good for the Bulls:

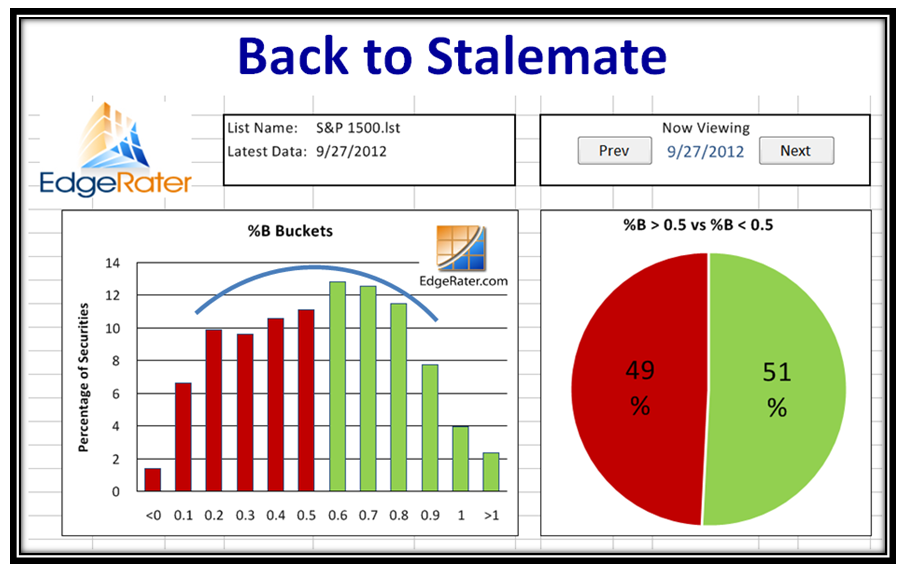
With Yesterday’s positive action, the S&P 1500 is back to Stalemate, with the expected Bounce Play on the ninth day:

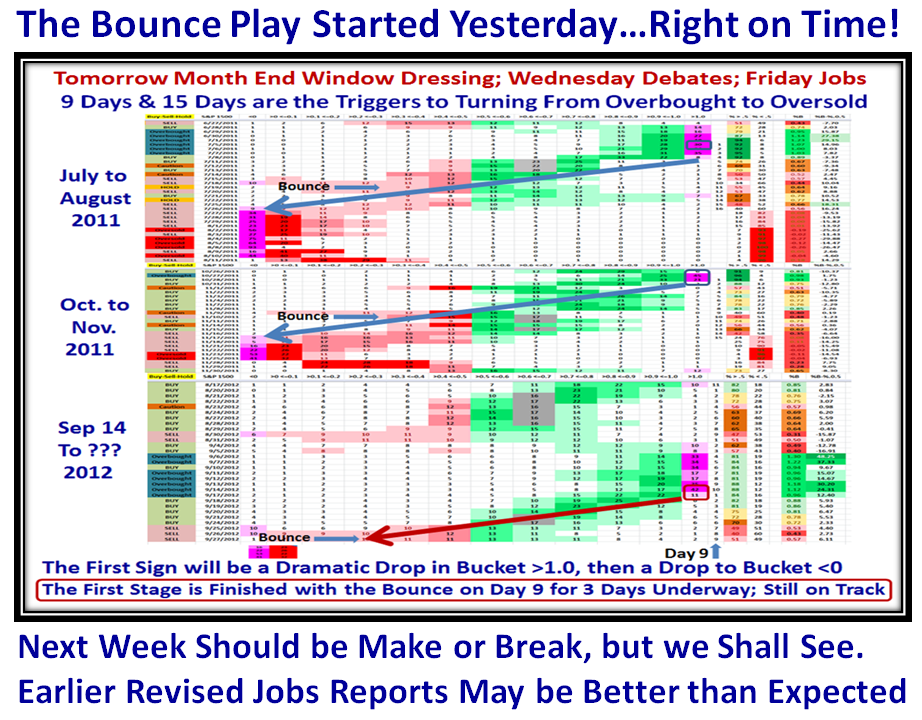
This next chart is shaping up nicely since I first talked about the possibilities nine days ago.  It seemed that yesterday the Big Boys were determined to have good window dressing for the month end results, and true to form they are fighting back with two hours to go as I write this blog note.  However, we have the Election Debates on Wednesday next week and finish things off with the Jobs Report on Friday.  The latest buzz is that revised estimates for earlier months are up, so although we know that September is traditionally a “low Month”, we shall see a week from today what the outcome is:

That should give you plenty to chew on, as this time next month Ron and I will be warming up in the Bullpen to greet our faithful supporters at the Seminar starting on Saturday, October 27th.  I assure you we will raise the bar one more time and you will be glad you came.

Best Regards,

Ian.

Stock Market: The Middle Road Scenario

Wednesday, September 26th, 2012

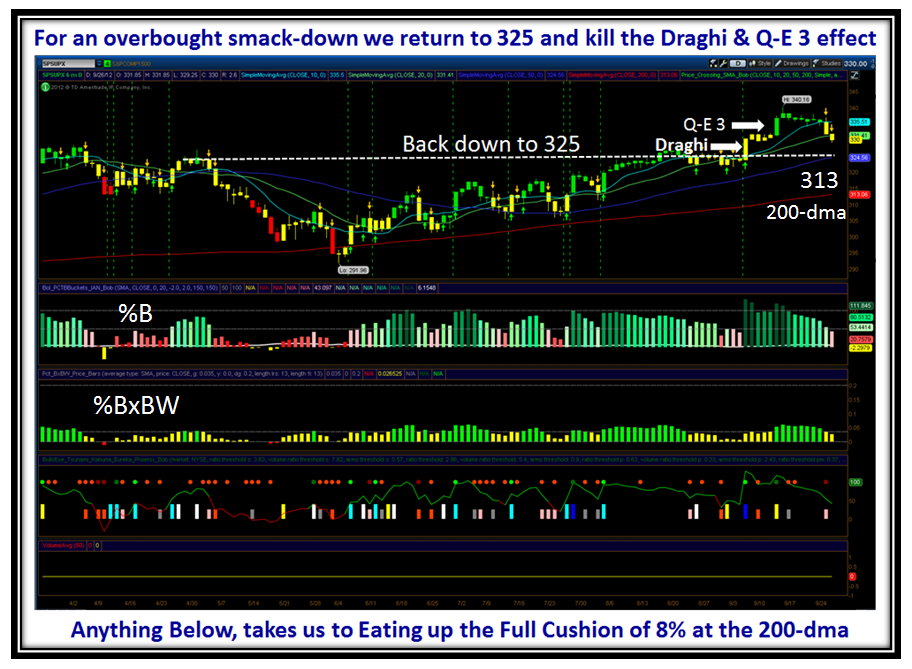
On the heels of my morning blog note, here is a follow up since the Market closed down today.  The game plan is simple as I see it in this S&P 1500 Chart.  Strong Support is at 325 at the 50-dma, and if it reaches that the irrational exuberance of the Draghi Plan and Q-E 3 will both have been short lived.  If there is any Bull Muscle, expect at least a Bounce from there.  If not then we trot down to eat up the other half of the 8% Cushion down to the 200-dma, when the floodgates of Fear will be in full motion.  Note how %B and %BxBW are both under water even at this stage.

Best Regards,

Ian.

Stock Market: A Shot Across the Bow or a Correction?

Wednesday, September 26th, 2012

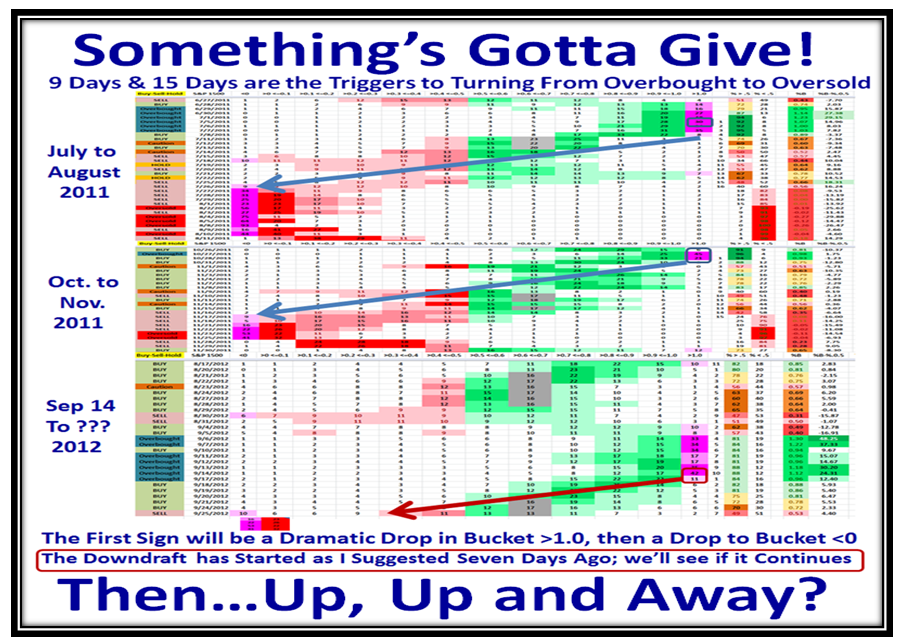
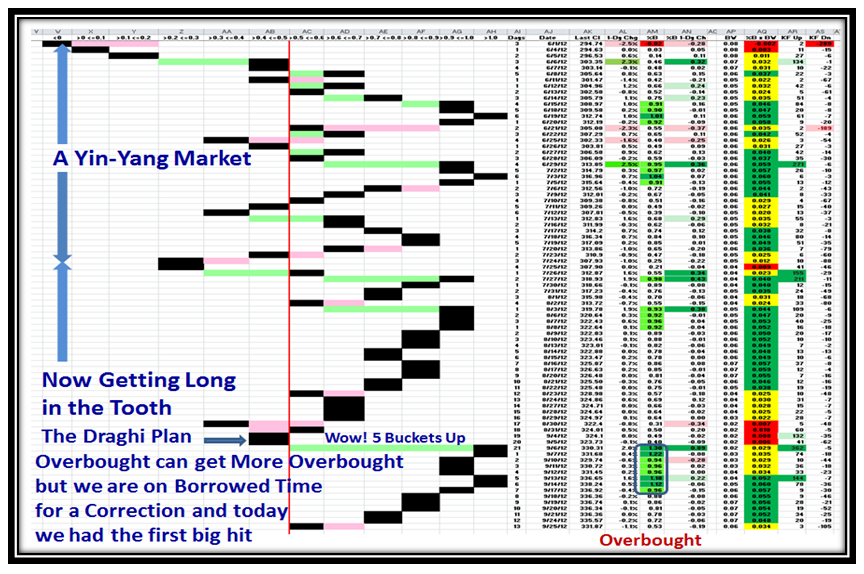
In my last two blog notes I explained the unusual overbought status of the Market Indexes and particularly pinpointed the 42% of the S&P 1500 stocks sitting above the Upper Bollinger Band, i.e., Bucket >1.0, as being very rare.  I also showed you the two other recent occasions when such a blow out had occured in 2011 and warned of the pending downdraft that inevitably happens at such times.  Seven days later we will review where we stand.  Said in a word we are at “Stalemate”, and given today’s action the bias is that we are probably headed down:
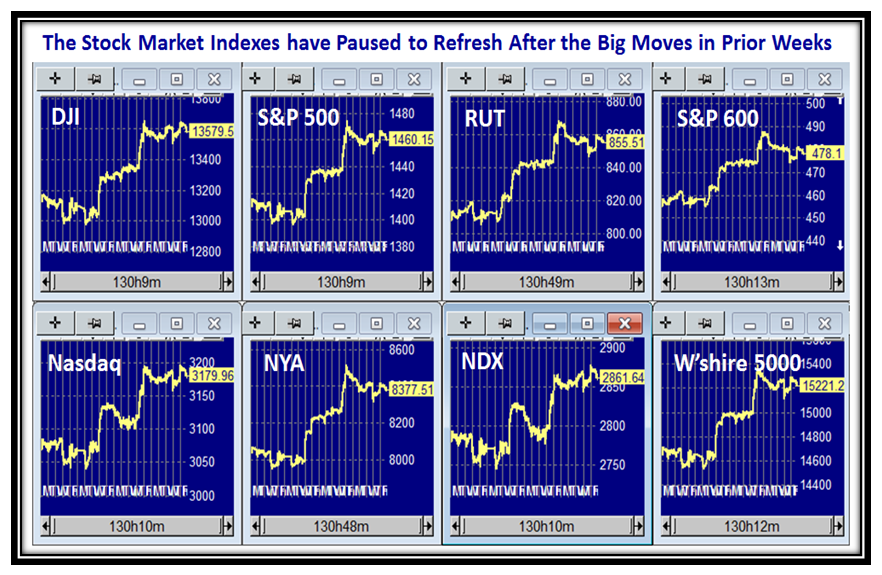
Let’s first look at the eight Market Indexes I regularly feature and the double Flag caused by the Draghi Plan in Europe and the announcement of Q-E 3 by the Fed which put the Markets into Overbought territory.  Whether this transfusion of optimism will last and the markets move higher after a pause to refresh remains to be seen, but for now we had an orderly move down for a week until yesterday when a Phoenix coupled with a Down Kahuna suggested a meaningful Shot across the Bow:
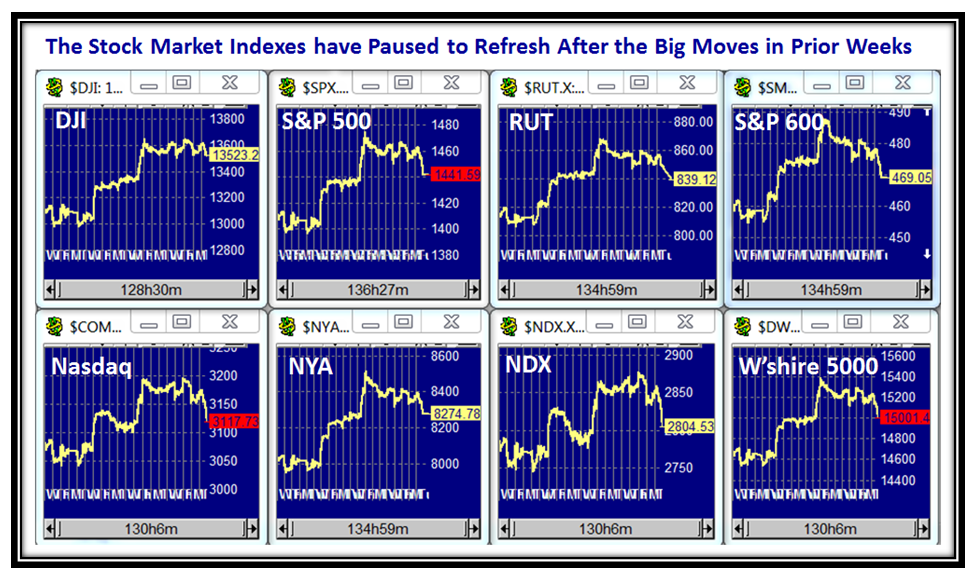
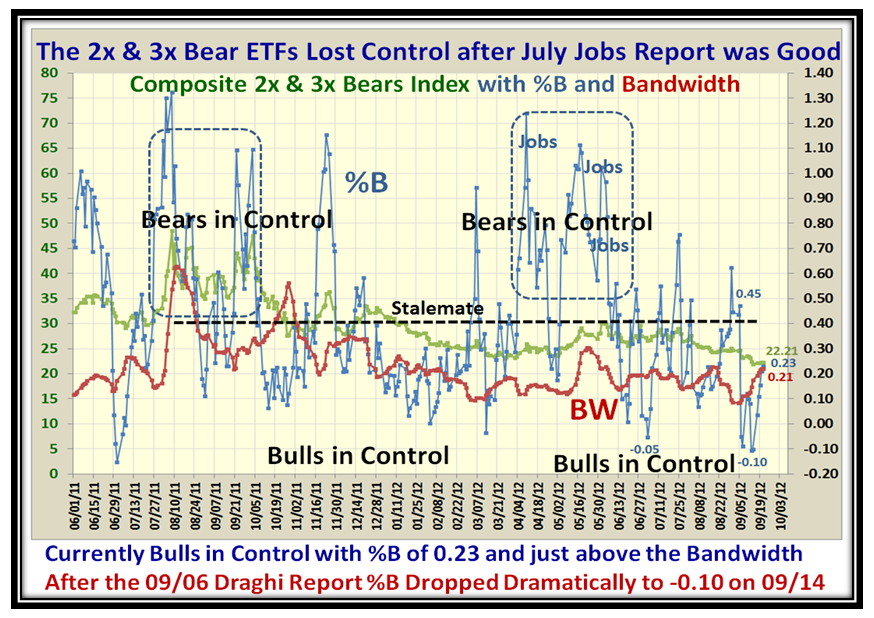
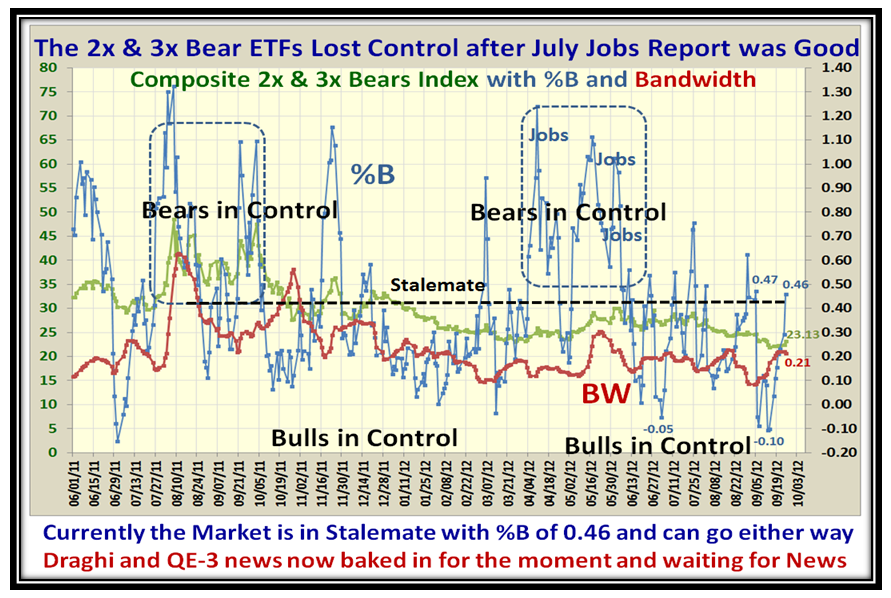
We see that three Indexes finished at their lows yesterday and all gave up the Q-E 3 “Kick” of eight days ago.  Now the question is “Do we wander on down to support levels before the Draghi Effect or do we hold here abouts and trot on up for the Bulls to gain leadership again with GOOG leading the charge and AAPL regaining its composure with a move up from the usual 35 to 40 point correction we have seen of late before it moves up again?”  As of yesterday we were at Stalemate as shown by who has Control using the 2x and 3x Bear ETFs picture:
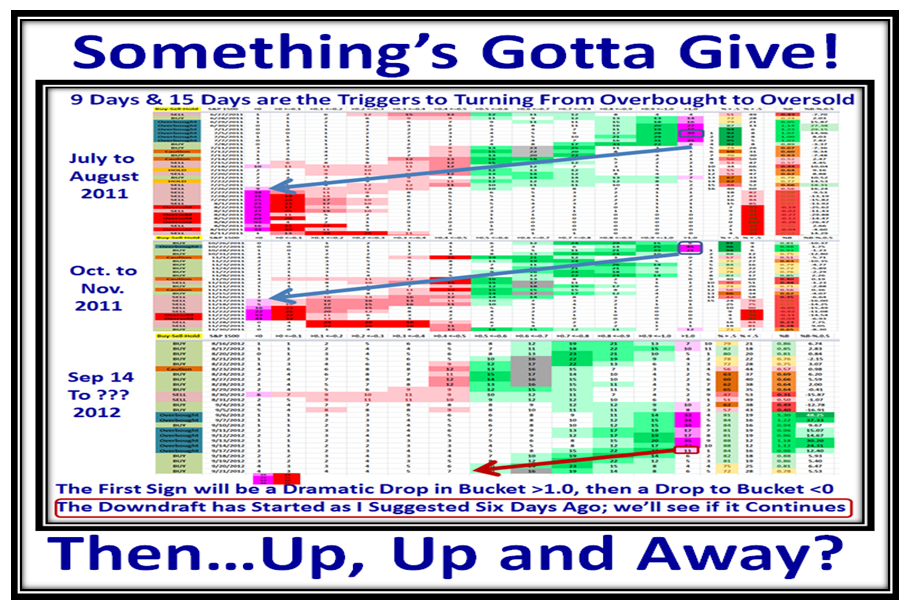
…And here’s the “Something’s Gotta Give” picture which is acting true to form.  If today’s action takes the S&P 1500 %B to an Oversold state in Bucket <0, then we could expect a Bounce.  That Bounce could be short-lived as in the previous cases shown, or we trundle up with a continuation of the Rally.  Let me remind you that the first Election Debate is next Wednesday, and who knows what the effect will be on the Stock Market?  Then on Friday of that week, October 5th we are back to focusing on the Jobs Report, so Traders and Investors be forewarned to be very much on your toes!
Here is the twin picture, which we have come to enjoy, with the latest drop showing a one bucket skip, but actually was a Kahuna down for the Nasdaq:
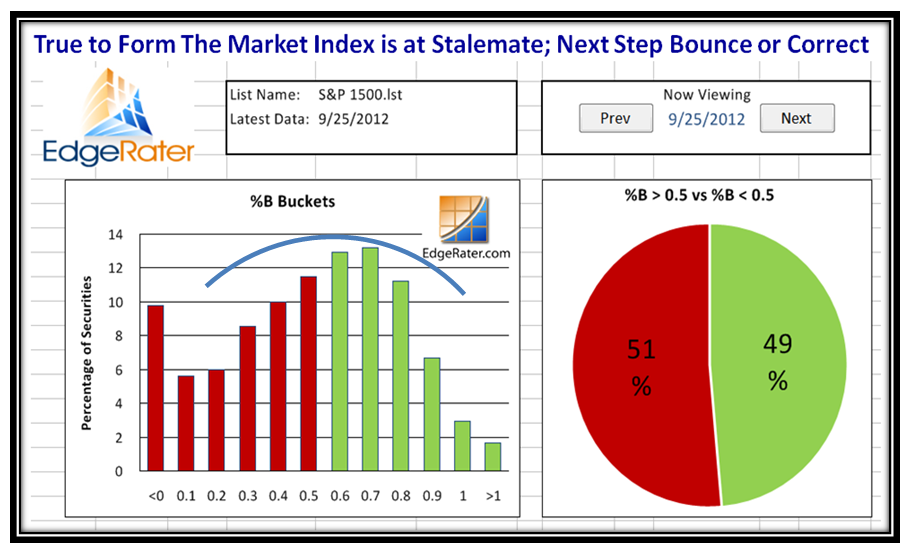
Grandma’s Pies show we are at Stalemate with the Bears having a slight advantage.  Note the ~ 10% in Bucket <0:
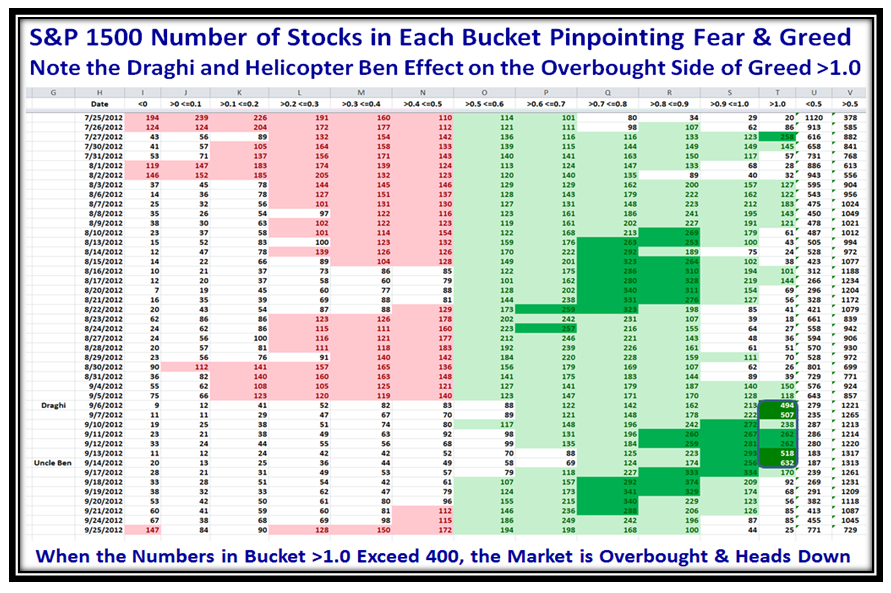
I am sure by now you can see that my efforts in all of this is to keep us on the right side of the Market by Managing Fear and Greed through an understanding of the underlying components of the Market indexes.  Here are three further pictures I share with you from time to time, but is very important to understand at this time:
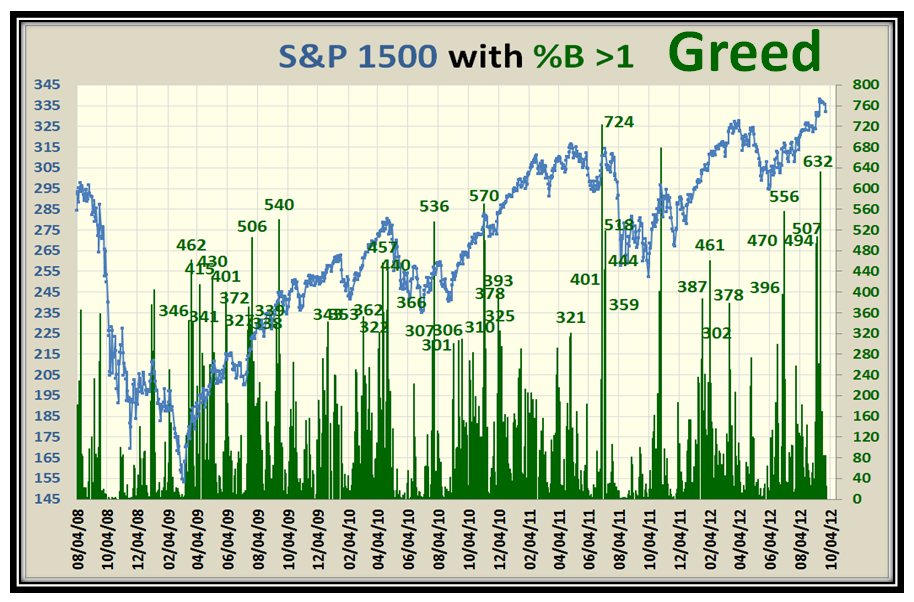
Here is the picture for Greed, concentrating on Stocks with %B in Bucket >1.0.  Note the recent 632 which is 42%:
…And here is the one for Fear.  We had 147 stocks for the S&P 1500 yesterday in Bucket <0.   Fear sets in at ~400:
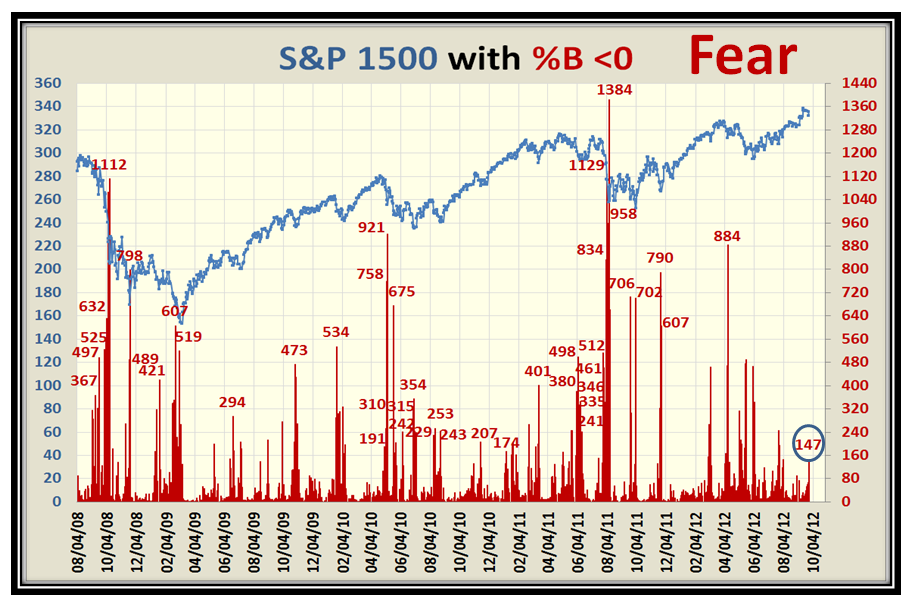
Now not only do you have the Game Plan which I gave you in my last Blog, but also the underlying principles of what to look for.  We have just four weeks to our Seminar and we have plenty of seats available.  Please sign up soon so that we can take care of logistics at this end.

Best Regards,

Ian.

Stock Market: Fed and Wall Street Game Playing

Saturday, September 22nd, 2012

Well of course we should expect the Market to go up with vigor when the FED announced QE-3, and as before they are scratching each other’s back:

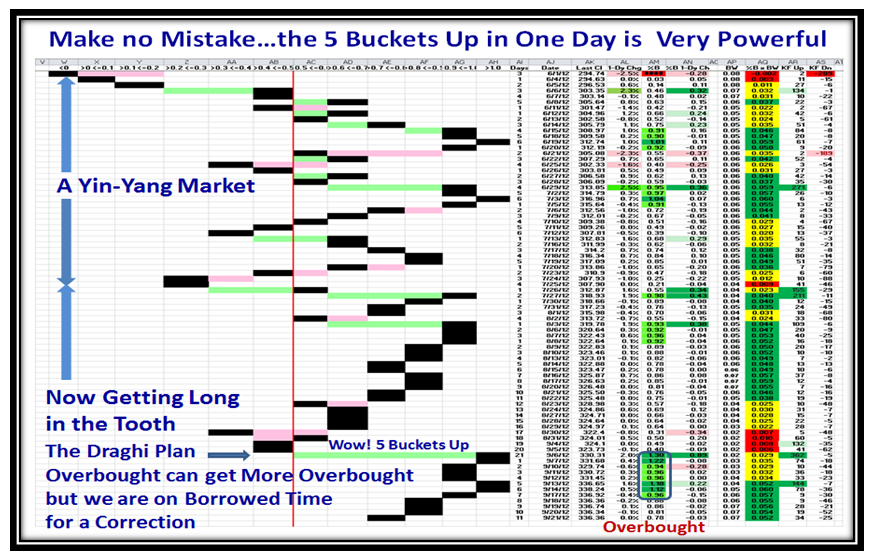
Here is the Double Flag up due to Draghi and Helicopter Ben two weeks ago that catapulted the Markets Up:

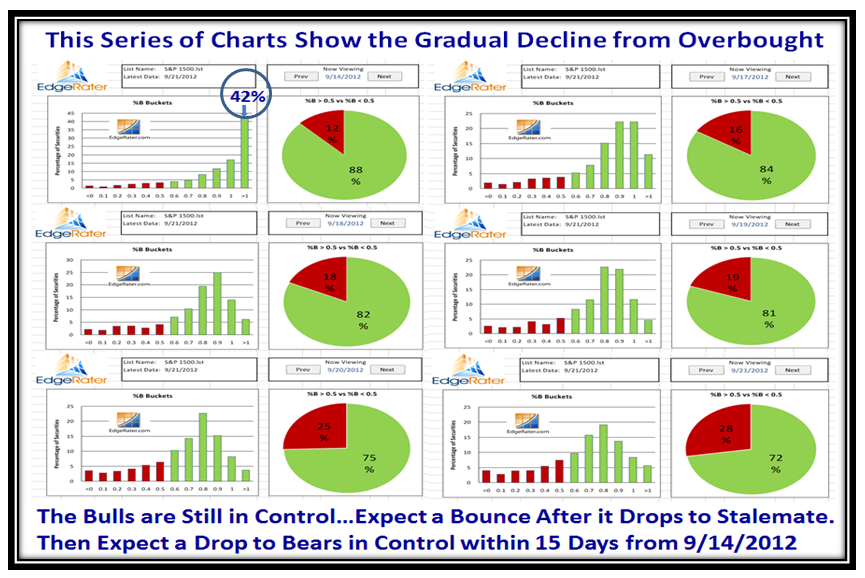
In the last Blog, I gave you a hint of what to expect based on recent past history, and so far it is working out.  Here is the updated chart which shows we have been trotting down in %B strength in the last six days:

…And this next chart will show you how Grandma’s Pies have weakened over the same period.  The Bulls are still in control but it won’t take much to move to stalemate of around 55:45 or so.  Since the trot down has been orderly, expect another small bounce from those who feel they should hop in and catch the next move up before the %B trots all the way down to seek a bottom as shown above:

Here is another view to confirm the gradual trot down in %B for the S&P 1500, since it was overbought:

…And this next chart caps it off for you that the Bulls are still in control using the 2x and 3x Bears ETFs:

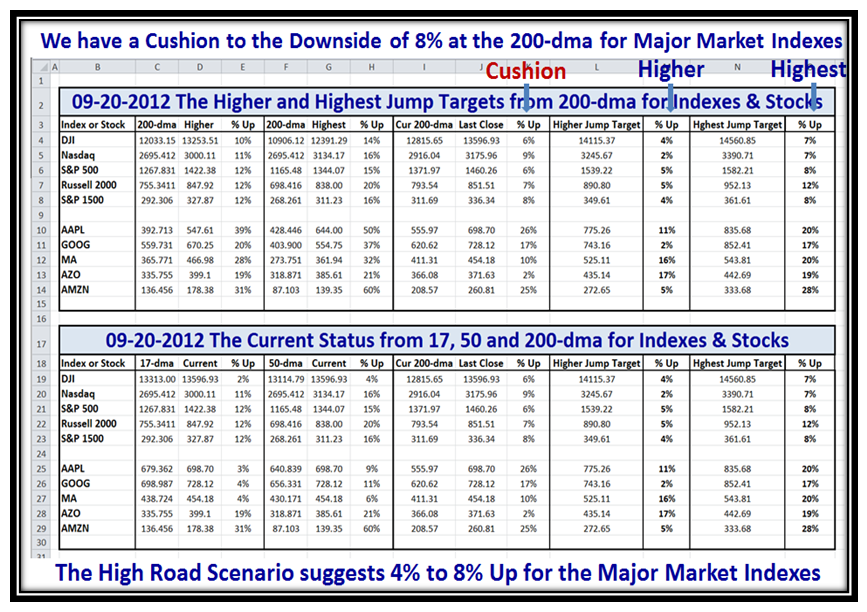
By now you are asking “So What and Then What, Ian?  What does your Crystal Ball tell you?”  Stick to the discipline and be ready for any eventuality.  When the Market Rally has got a trifle long in the tooth and you see breakaways from the 200-dma, your mind MUST turn to the High Jump!!  Don’t ever forget it.  So to show you what I mean, I took the time and patience to produce the following chart, which reveals some interesting pieces of information.

Get your Beady Eyes on the Arrows called CUSHION and the two to the right for % Up for Higher and Highest Road Scenarios.  We see we have a safe cushion of 6% to 9% for all the Market Indexes shown.  We also note that GOOG which is heading straight up is only 2% from its historic Higher Perch, so GOOG is the one to watch to see if it stutters or carries on to up at $743.  Also if this market continues up expect 2% to 5% on the upside for the Major Market Indexes, before we either stutter or continue on up:

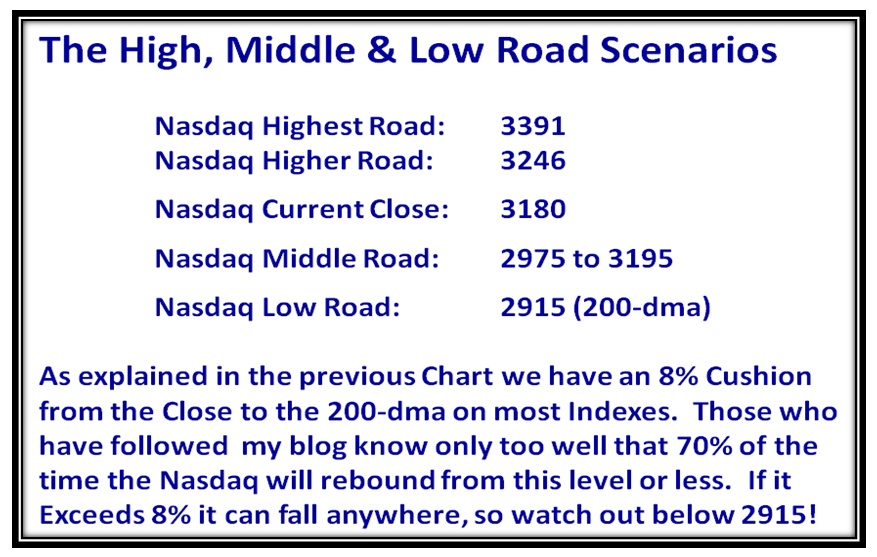
To simplify all of that down to one chart to keep next to your elbow, here are the key factors for the Nasdaq:

Now you are armed for the next few days to weeks at least with the above scenarios.  Never fall in love with any scenario, but let the Market tell you which one it is on against this plan.

Our Seminar is just five weeks away and we have plenty of seats available for those who feel they would like to come and learn how Ron and I keep you challenged to cope with Fear and Greed and make the most of the Rallies in between!

Best Regards,

Ian.

Copyright © 2007-2010 Ian Woodward
Disclaimer: Commentaries on this Blog are not to be construed as recommendations to buy or sell the market and/or specific securites. The consumer of the information is responsible for their own investment decisions.