Ian Woodward's Investing Blog
Archive for the ‘HGS Principles’ Category

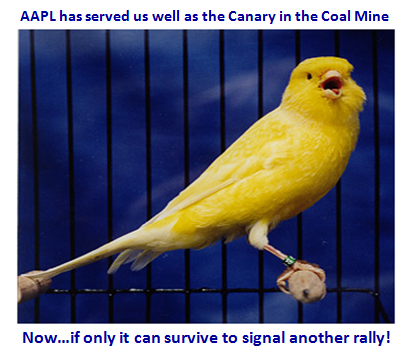
Apple…the Canary in the Coal Mine?

Wednesday, June 9th, 2010

Mail Bag:  Ray says  “AAPL is losing its lustre.  I think we need to find a new canary”

                   can

Ray:  You make a good point, and that is an easy call.  It’s right under our nose… NFLX; ERG of 286, 4th from the top on ERG, mighty strong, EPS Rank,  Rel Strength and Group Strength.

But that is not the purpose of the exercise.   The purpose of the JIRM Index was first to catch the early weakness, then to know whether the leaders were giving up the ghost and finally to know when the Market is DEAD.  However, I say don’t switch horses in mid-stream.  If this market is to go “DEAD”, AAPL will keel over long before NFLX…you mark my words, and I will certainly eat crow if I am wrong. 

By all means have two canaries…I can go along with that.  The purpose of selecting the key Canary was to smell the poison early, but with a strong stock that had Halo.  At the time, AAPL had the Halo, but subsequently it added to that Halo by announcing Stalwart Earnings. The poison of the market has now demonstrated several things:

1.  They are hammering Technology which was fat with profits of which AAPL was the surrogate
2.  They are ignoring the Great News on AAPL of a few days ago which announced 2 Million units of its latest product
3.  They are ignoring the latest news made just yesterday from our man Steve Jobs of its next product

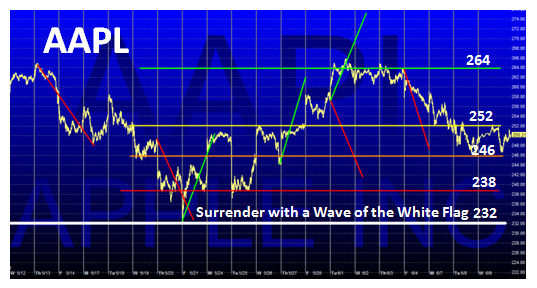
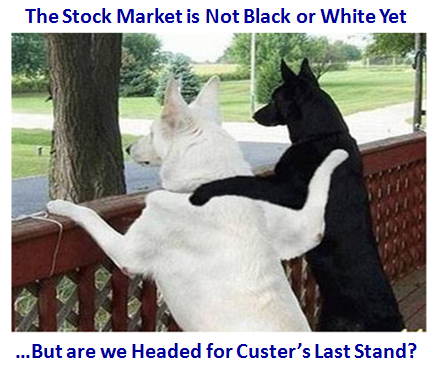
Those three points speak volumes as to the major bias right now…downwards.  Therefore, with the added burden that the Market Indexes have now all registered an Intermediate Correction, I don’t have to tell you that we are decidedly at “Custer’s Last Stand” given the testing of the double bottoms on all the major Indexes today as Ron pointed out, and that AAPL is truly losing its lustre.  If it dies, so goes the market.  Of course there are always pockets of opportunity on the upside, but in the bigger picture, we will then be faced with the next question “What is The Road to Recovery?”  Very few Recoveries occur without Technology and Financial’s leading the way.  Retail helps, but not without the others.

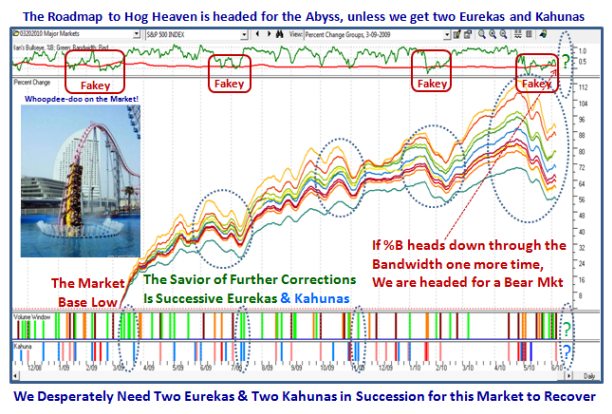
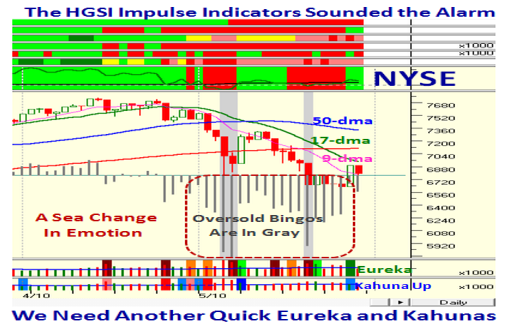
From the work I have done it is now even more critical that we need not one, but two, Eurekas in succession and they must be accompanied by two Upside Kahunas.  “Why?”  Because no Intermediate Correction has recovered unless the %B was above the Middle Band and preferably at 0.6, and at this stage of the Game %B for the Composite of the ten Indexes we follow is only at 0.19.  I am not for one moment suggesting that given such a solid bounce we will be out of the woods, but at least we will have some cushion before a further collapse…should that occur:

         Canary AAPL

Best Regards, Ian.

Follow Through Days (FTDs)…What’s an usun to do?

Sunday, June 6th, 2010

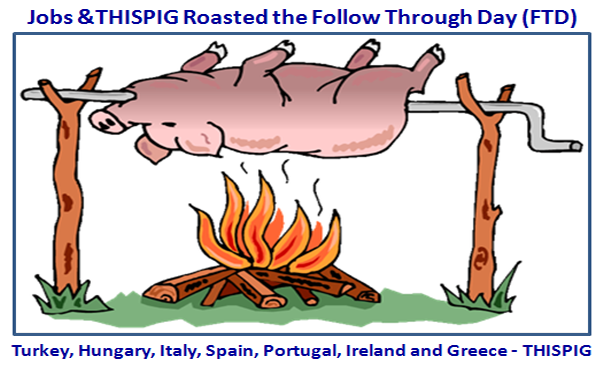
ftd roast pig

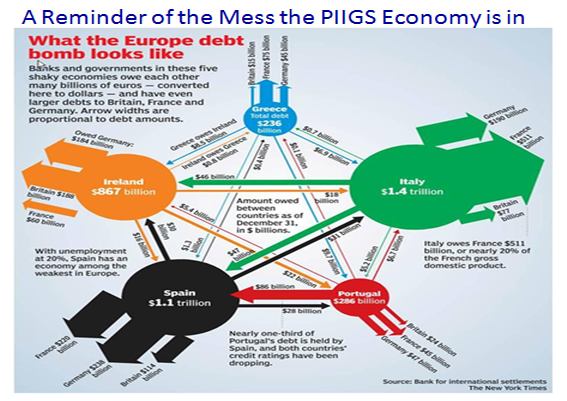
   FTD PIIGS

The last couple of weeks the Bulletin Boards have all been abuzz with the Follow Through Day (FTD) good stuff.  Worse luck the simple aspects of an FTD in the 4th through the 10th day (7th by those who are more cautious) is just not enough in these volatile times to be assured of a turn around, leave alone any form of a rally.  The so-called FTD lasted exactly one day before the Bears lowered the boom with a Phoenix on a -3%+ day in the Major Market Indicies.

I gave you the caution to watch for in my last blog for signs that there is at least a chance of a recovery.  But before we get to that, there are three types of “Game Player” in these modern times that we need to understand in the scheme of things:

1.  The latest buzz word is HFTs…High Frequency Traders who scalp pennies in nanoseconds with millions of shares and have become the bane of our lives, as we must find ways to understand their shenanigans with modern tools.

2.  The very short term Intra-day Trader who is used to the whims and fancies of the former and have learnt to stay on the right side of the market and can swing from long to short in seconds if need be.  They understand volatility in spades, have tools that can differentiate between Large Players and Small Players with regard to which side of the volume curve they are playing with due regard to price movement, and are accustomed to being glued to the futures that give them a leg up on which way the wind is blowing, intra-day.  Likewise, they are adept at looking at reverse ETFs and managing the “Chop-Chop” in spades.

3.  Then there are “usuns” who at least want re-assurance that when they get these signals from old tools of FTDs that there is at least a fighting chance they are signaling a decent call more than the 50:50 bet that one gets today.  Unfortunately, if the Financial Newspaper says it’s so, it is good enough for the herd to follow, and thereby usuns are realizing that there must be a better way.

If all of that is not enough, there is now the problem that news around the world is instantaneous to all and a supposed slip in a single “bet” of 1 Billion shares instead of 1 Million can cause what is now called the “Flash Crash” of a few weeks ago.

Many moons ago it dawned on me that John Bollinger’s Bands and specifically his %B and Bandwidth gave me just the type of Stakes in the Ground and Measuring Rods to help “usuns” to stay on the right side of the Market at those precious times when the Market provides High Volatility with swings of > + or – 2% to 4% days in price.   They gave me the ammunition to understand unusual turns in the Market both at the top and at the bottom with days when the standard deviation is >3% from the norm. 

 The outgrowth of the past ten years of work is the Impulse Indicators I have developed for you.  It didn’t take long for sharp minded people with equal interests to build on these concepts and this has produced a far better mousetrap with regard to FTDs.  People like Jerry Samet, Aloha Mike Scott, Tarzana Mike Scott, Bill Roberts and more recently Tom Ellis have all played a hand in at least knowing when the odds are with or against us.  Since these folks are generous givers to help the usuns along, here are three cardinal rules based on the tireless work they have done:

1.  80% of FTDs fail if there is no Eureka.  This one had an Eureka
2.  75% of FTDs fail if %B 1-Dy Chg is <0.18.  This one had >0.21 for the Composite of Market Indexes we follow
3.  80% of FTDs fail if %B is below the Middle BB.  All Major Market Indexes except the NDX were below 0.50

So you say two out three is not bad, until THISPIG by way of Hungary throws a spanner in the works and the Jobs Report turns out to be less than scintillating.  I’m sure we cannot account for what might happen say the intra-day players.  But, wouldn’t one think it prudent to wait before making the Official Call on a FTD when something as BIG NEWS such as the Jobs Report is only one day around the corner, and the call was made on just an iddy-biddy increase in Volume on that day on the Nasdaq and not the other Indexes? After all, the Value-In-Time folks knew better in that the Big Players had not covered their shorts!  This penchant for calling THE BOTTOM is the problem of Greed.  Now we sit with a Phoenix on Friday with heavy momo from negative Kahunas and all but the Nasdaq 100 and Nasdaq are below 0.20 on %B.

So, I leave you with the picture as it is today, and hope you find a pony in it as we have done for the last year:

ftd roadmap

Best Regards, Ian.

Stock Market Stalemate and Latest Targets

Sunday, May 30th, 2010

     Picture

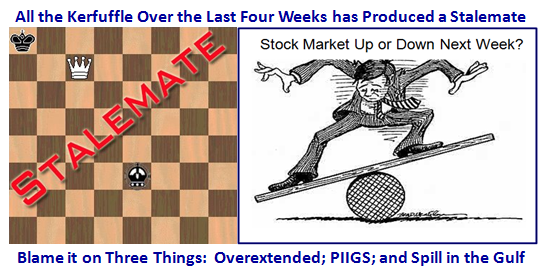
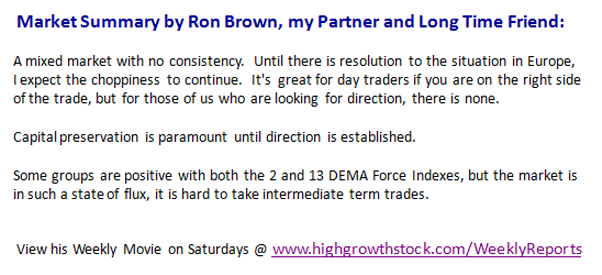
Here are some quick thoughts for the Long Weekend.  Ron Brown in his Weekly Report has captured the essence of the current situation and I have featured his comments below:

summary

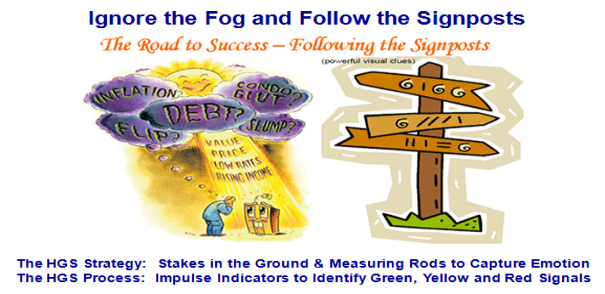
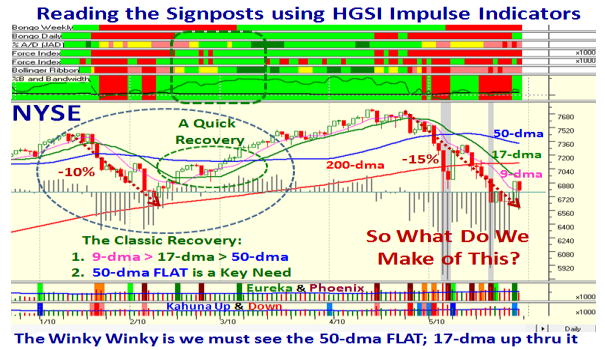
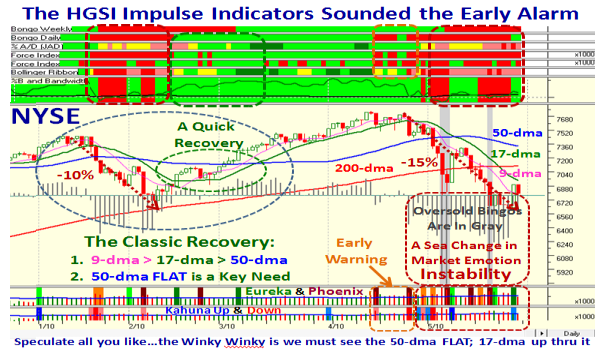
In times like these, use the HGS Strategy for understanding the Pulse & Emotions of the Market using Stakes in the Ground and Measuring Rods, and bolster your confidence with the HGSI Software Impulse Indicators to show you the Roadmap:

fog

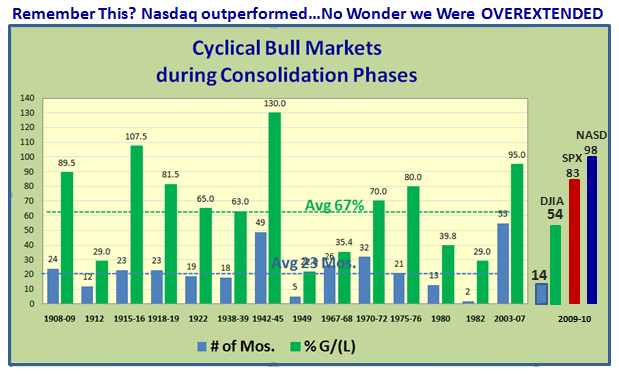
The first reason for the Intermediate Correction is the Nasdaq was well Overextended:Nasdaq Overextended 

The next several slides show you the news related causes of the unstable Economy of the “PIIGS” and the calamity of the Oil Spill in the Gulf, which have so far led to an Intermediate Correction and is now in the balance as to whether we repair or go down further.  The Bias is downwards, but at least for now the Critical Lines in the Sand I have given you have held.  It shows that the High Jump and Limbo Bar are useful tools for establishing the potential Targets at any given point in time:

Signposts NYSE

NYSE Now

NYSE Last

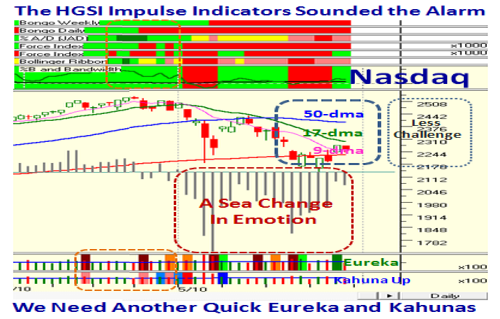
Signposts Nasdaq

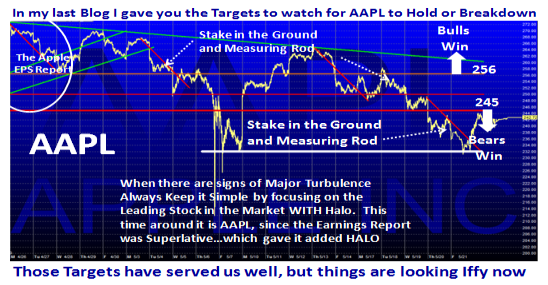
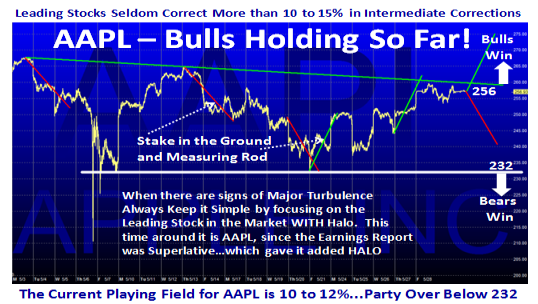
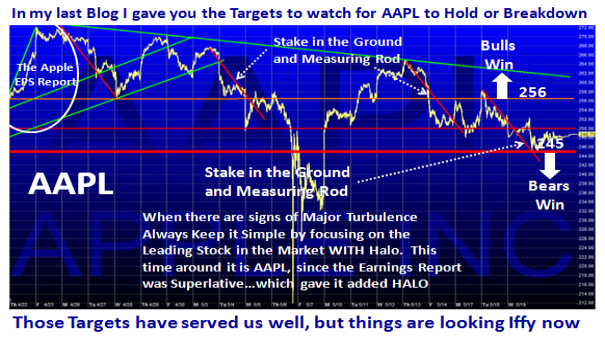
When the Rot set in I told you to keep it simple, and that was to zero in on AAPL, being the leading stock with lots of fresh Halo.  Note that although it too has suffered from the recent buffeting, it is holding up and may well be the signs of good times to come, but longer term players must still be patient:

AAPL Recall

AAPL Now

Custer

 The Immediate Targets to Watch For:

 Type 1 & 2 Traders play to your hearts content since you are nimble, but I wish you luck if you are to put up with the intra and inter day volatility where only the quickest of players can stay on the right side of the market and win.  Types 3&4 be patient, and remember just these few solid Stakes in the Ground and Measuring Rods:

1.  We need more Eurekas confirming the Big Players have REALLY turned bullish

2.  The strength of their conviction will be with Upside Kahunas (1-Dy Chg in %B) firing at the same time

3.  Look for the 50-dma Flat with the 17-dma coming up through it at the 405 Freeway which eventually will happen “In the Fullness of Time”.  At that stage, Bongos Daily and Weekly will be Green, Force Indexes will be Positive and the RoadMap to Hog Heaven will be screaming GREEN! 

hour 

It’s not difficult with the IMPULSE INDICATORS we have in the HGSI Software.  Your comments and feedback below are always welcome in return for what the HGSI Team of Ron, George, Matt and I give you.

Best Regards, and spare a thought for our troops abroad and those who gave their lives for this country.  Ian

Stock Market at Custer’s Last Stand?

Monday, May 24th, 2010

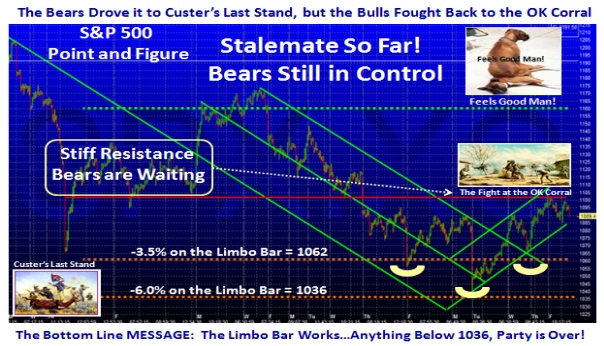
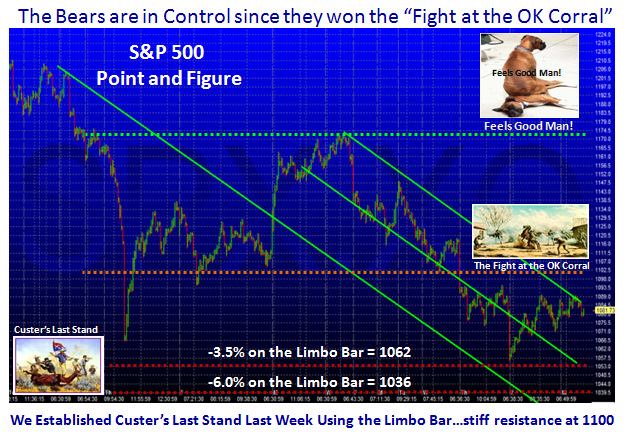
When we reach a critical point in the Market, it is important to understand where the Lines in the Sand are at, and we are probably at Custer’s Last Stand: 

                 black

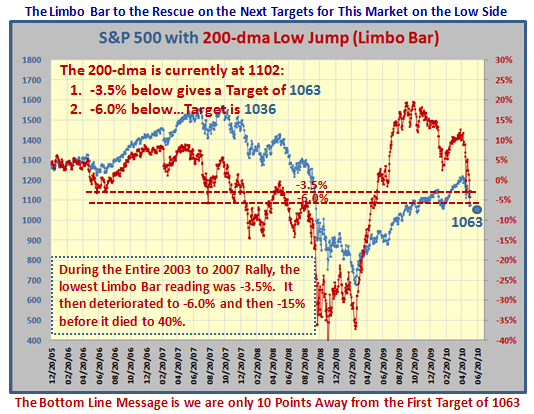
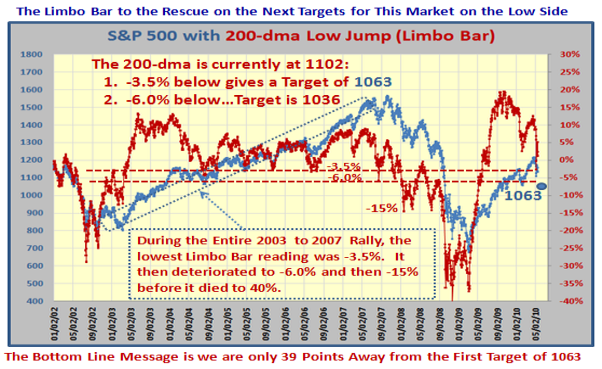
Last Week I used the Limbo Bar to establish the probable last lines in the sand and I repeat the updated chart below:

    limbo

There is little doubt that the Bears are in Control as shown by the S&P 500 Chart:

custer s&p 500

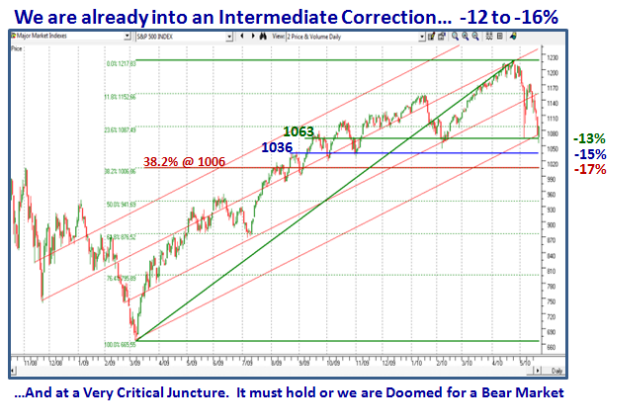
We have already dropped ~12% from the High of the S&P 500 so we are into an Intermediate Correction of 12 to 16%.  I show the Limbo Bar lines on the next chart along with the Fibonacci Line at 38.2% for 1006, so naturally 1000 is a good place to watch if the other two do not hold.   If that breaks we are into a Bear Market Correction:

custer chart

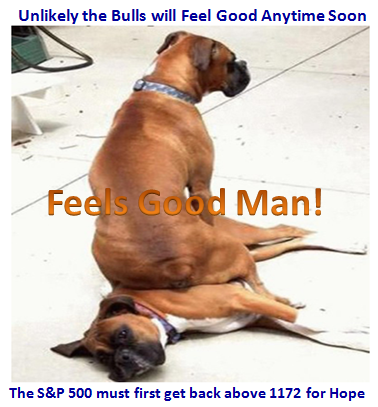
The Market will have to repair a long way back before the Bulls can “Feel Good”!

                   custer boxers

Good Luck.  Ian.

Stock Market: Scary Ride – Targets from Here?

Wednesday, May 19th, 2010

I just got back from a little R&R with my Son and his family, so here is an update based on a note I wrote to my friend Keith in New Zealand, which I answered yesterday, but have embellished today for all of you who read my blog.

                              scary

Question:  Hi Ian – so whilst High Jump helped identify possible tops, does any HGSI tool predict the likely level of falls in this new downtrend?

Keith  New Zealand

Answer:  Hi Keith – Yes, it’s called the Limbo Bar!  As you might have guessed, it is the reverse of the High Jump.  Let me offer a few pointers:

1.  I use Rules of Thumb which comes from over 25 years of experience:
      a.  Minor Corrections are 8% to 12%
     b.   Intermediate Corrections are 12% to 16%
     c.   Major Corrections are 16% to 20%
    d.   Bear Markets are >20%

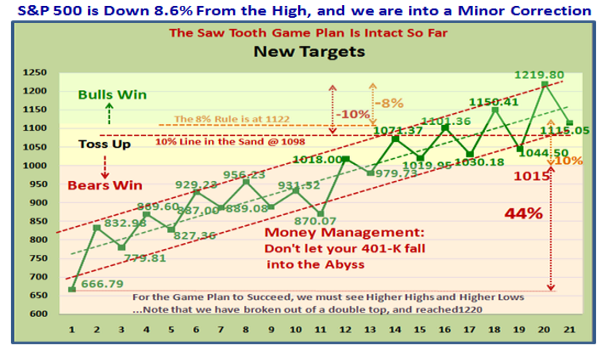
2.  As I am sure you have heard me say if you read my blog notes faithfully…There is a 75% probability that the S&P 500 will correct no worse than 8% Close to Close and then rebound.  Heaven help you after that as it can fall anywhere.  We are on the hairy edge by being 8.6% down from the high with no cushion:

saw

3.  We are also close to the Bottom on the set of Targets I gave you for AAPL last week:

scary ride

4.  There is an excellent blog note I wrote on the subject with all sorts of statistics that you can read about if you will take the trouble to scroll down to  November 23rd, 2008 labeled “The Worst Market Conditions since 1937, Surpassing 2002”.

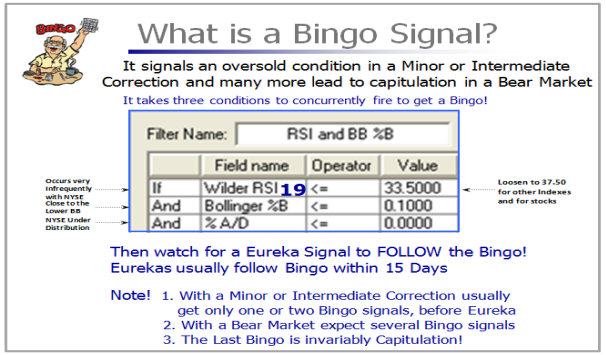
5.  No tool can FORECAST HOW LOW this correction will go…if you find someone who can do it, please let me know.  We have two good tools in HGSI which help define the Targets, one is the Limbo Bar and the other is Bingo followed by Eureka(s) to start a fresh rally.

6.  The Low Jump or Limbo Bar:  This is the % distance of the 200-dma of the S&P 500 to the Low of the Index as shown in the next chart.  Our past experience for the 2003 to 2007 Rally gives us an excellent perspective of what to expect if the Rally is to continue and the Targets that must not be exceeded as shown below:

limbo

7.  The Bingo Accompanied by Eureka(s):

bingo

ss

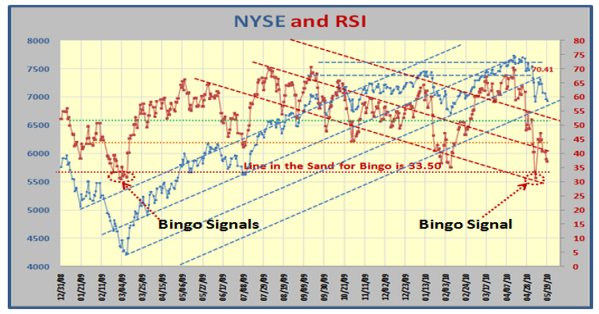
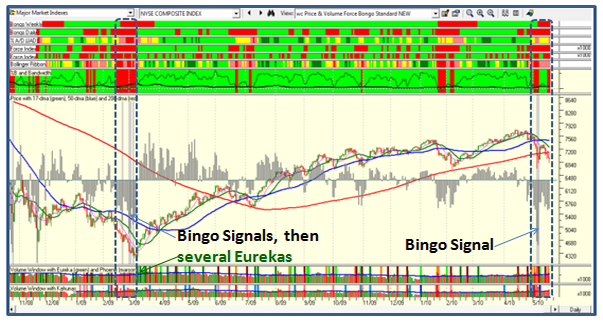
However, what we also look for is a Bingo followed by two Eurekas in quick succession to suggest that a Bottom has been reached.  Alternatively, if the market just deteriorates from here, you will see several Bingos (grey bars on the NYSE chart using the wc View).  Eventually there will be several Eurekas to suggest the Bulls have finally got control and we start a new Rally upwards.

wc

Now that we have a Guideline, either sit out for now, or Short, or sharpen your pencil for New Leaders from those that have not broken too much during this downturn.

Best Regards, Ian.

Copyright © 2007-2010 Ian Woodward
Disclaimer: Commentaries on this Blog are not to be construed as recommendations to buy or sell the market and/or specific securites. The consumer of the information is responsible for their own investment decisions.