Ian Woodward's Investing Blog

Archive for the ‘HGS Principles’ Category

It’s Very Clear our Volatility is Here to Stay!

Tuesday, November 11th, 2008

light

With apologies to George Gershwin  and an old favorite tune many moons ago which Gene Kelly danced with Leslie Caron on the banks of the Seine, I’m afraid our Volatility is here to stay forever and a day!  Times have changed and we will need to get used to seeing 300 to 600 point swings a day as commonplace on the DOW, 50 to 80 on the Nasdaq and 25 to 40 on the S&P 500.  Likewise, 20% knee jerk moves within a few days both up and down should also be expected to be commonplace.   It will be a while before this volatility subsides. 

The following is a spreadsheet of the nine other Bear Market occasions where the “Swing Down” has been greater than 20%, followed by a Rally Up and then a re-test of the Lows .  The picture below is worth a thousand words and confirms the expected odds:

stats

I have shown the % Gain/(Loss) and the calendar days for each step down, up and down again.   As you can see on the left hand side, the average and median numbers are so close to each other that the probabilities of these numbers occurring are high.  On the right hand side, the days are all over the place, but if you look at them carefully they fall into two camps, short and long term. 

Another point to notice is that the re-test is invariably less than the Rally Up, which suggests that we have probably found a bottom, unless there is some other major global surprise that raises its ugly head.  The Bounce Play occurred in two days flat and the re-test started on October 14, 2008.  It is now a month since that high, so we are on track to seeking a bottom soon.

The above statistics are for the S&P 500.  Note I am using 17% down based on the above for the re-test of the Lows; anything worse than that suggests 2002 like numbers of >-20%:

The Key Lines in the Sand to the Downside are:

table

We can see that we are just 6 points away from being 17% down on the Nasdaq, and no more than one day’s worth for the DOW and S&P 500.  As we can see, the DOW has behaved the strongest in this past month with the Nasdaq the weakest.  It has been 29 days since the re-test started and as one can see from the table, three of the readings are 33 or 34 days for previous re-tests, so we are on track!   We must hope that this will not end up with another crater to the downside, and that we will see no worse than a Double Bottom for now before we head back up. 

The $64 question is “Are we close to the end of the gloom and doom or do we head down further with more misery in store before this market can recover into a Bear Market Rally?”

The market started to drive up last week where two Eureka’s accompanied by Kahuna’s showed some signs of recovery underway.  Once that trend upwards was broken to the downside as we witnessed these past three days, the whole process must start again, so we must look for a Reversal Day as the first step in the recovery process.  We first look to Capitulation with a Spike in New Lows which is currently at 324, but could get as high as >1000, then look for a Reversal Day, and a Follow Through Day thereafter.  The short answer is to take it a day at a time for the moment as the market is still too jittery to give a clear indication of the start of a bear market rally.

Best Regards, Ian.

This Stock Market has the Jitters!

Thursday, November 6th, 2008

shark

We got our answer today…the DOW could not hold at 9250 and down she went for another 443 point day to the downside.  It has become a trifle monotonous to see the same story unfold these past four weeks, with any hope of a Bear Market Rally now very suspect until we get through all the overhead supply that the last week has provided:

dow

The picture speaks for itself and this game plan is solid as to where the fight at the OK Corral is at.  At this stage of the Game, the only thing for Type 3 and 4 Investors is to sit in cash and be thankful for small mercies as this is too treacherous a market for one to throw your hard earned money at.  As I have said before Types 1 & 2 are enjoying the volatility and when  one can make 15% in a day on the FXP and 8% on the QID, that is money for jam.  Now we have the birth of triple ETF’s so those of you who are high rollers can enjoy to your heart’s content if you have the stomach for it. 

It seems we caught the proper mood at the seminar, and we will just have to wait and see if we can climb out of this mess.  Recall the overlay charts I cobbled up to show you what a double and triple bottom could look like and you will realize that we are faced with six months to a year of ebb and flow before we can even begin to think of a decent recovery.

Today’s action has broken down the attempted rally which has fizzled into a Broken Bounce Play.  As I show in the diagram, all the good work of the previous week which I covered in the last blog has been wiped out and that congestion we see between 9000 and 9250 now becomes stiff overhead supply.  We have to start all over again with Capitulation, Reversal Day, Follow Through Days, Eureka and Kahuna signals to the upside before we even get a glimpse of a new beginning.  At least we can say that we now understand the Bango Process, and you are the richer for having taken the time and expense to learn what to look for.

Now that “the buy the rumor sell the news” phase on the Election is behind us, the Market remains uncertain and that is what is causing the jitters.  It will not rest easy until the incoming administration identifies two key positions, Treasury Secretary and the Fed Chairman, and then watch out either way depending on whether the Market likes the selections or not.  Of course those are not the only concerns but in any event it seems obvious that this bottoming action will be a long drawn out affair and at this stage of the game, the odds favor the Bears.  After all the yardstick suggests we are but two days away from breaching the bottom.   Five percent days up and down have become commonplace, whereas a month ago we were marveling at it. 

Warren Buffet can afford to throw a few million here and a few there and a few more out the window and not flinch, but he must know something that you and I don’t know.  My suggestion is to let the market tell you what to do based on proven Stakes in the Ground and Measuring Rods, unless you are a soothsayer or have deep pockets like him.

Best Regards, Ian.

Stock Market – Is there a Chance of a Bear Market Rally?

Wednesday, November 5th, 2008

ships

A week ago I gave you the important Lines in the Sand to determine if the Bounce Play would hold or drop down to re-test the recent lows.  With six days in a row of positive gains the market as shown by the DOW has broken out of the Key Resistance Line at 9250.  Before one can count on a change of short-term sentiment to the upside, we must watch the extent and depth of the pull-back that is occuring today.  If the Market can hold at 9250 over the next few days, and bounce off that level, we should expect a run for a Bear Market Rally.  Anything lower than 9000 and the Bounce Play is suspect and we would most likely re-test the lows.

dow

I have selected four charts which should show you that the Internals of the market have improved this past week but the caution is that we are by no means out of the woods.

1. The first and most important signal the Bulls have been waiting for is that we have had two Eureka signals within a week as shown by the green bars on the Nasdaq chart below.  A Eureka signal is music to the Bulls ears as it is a sign of irrational exuberance on their part and a signal that there is buying enthusiasm off a Market Low.
2. The second item is that the Force Index has turned positive the last four days.
3. The third item is that the Bollinger Band %B is now at 0.80 and this gives breathing room for the Bulls before it should retrace to the downside.

nasdaq

4. The next chart shows the improvement, albiet slight in the Industry Group Internals.  There has been a decided shift in those Industry Groups that are under distribution towards Accumulation.  There are none with “E” distribution, though we had a major shift yesterday towards D and C.  However, please note that the number of New Highs are still very low as would be expected with the devastating downfall the market took three weeks ago.

internals

5.  In my last blog I finished up with a “Ray of Hope” chart which I have updated below for your convenience.  It shows that %B of the Bollinger Bands is now at a lofty 0.80 and this will give a decent cushion before it could retrace towards the Bandwidth line. Note how this latter line has come down dramatically from the record levels above 0.40 of two weeks ago, which demonstrates that the volatility has subsided somewhat.  That is all relative as we are still seeing 300 point up and down days in a row as witnessed by yesterday and today.

%B

6. Finally, I show the marked improvement in the # of stocks with Bongo Daily “Yes”, implying they are approximately above the middle Bollinger Band, which usually serves as a springboard for better things to come in selected stocks.

bongo

In summary, the key points to watch are:

a.  The retrace must be held at or above 9250 for any hope of a Bear Market Rally

b. There should only be small dents in the factors I have shown you in the above charts for the rally to continue

c. We could do with a further Eureka and also a major improvement in the number of NYSE New Highs

d. This latter item must consistently stay above 100 with the # of New Lows below 50

For the intermediate and long haul, I do not expect this market to give a gigantic leap forward for the Bulls; rather we will probably see a long drawn out struggle for the next year as the overall Global Market conditions hopefully repair themselves from this financial debacle we find ourselves in.  At least the Libor rates have come down significantly which helps confirm that some positive results are being felt in the credit crunch situation.  I strongly suggest do not jump the gun until there is a second attempt at a rally and even then play it close to the vest.

Best Regards, Ian.

Stock Market – Itching to get back in?

Friday, October 31st, 2008

Happy Halloween to you all:

happy 

Type 4 Long-Term Investors are safely tucked in their Foxhole waiting for more signals to confirm this is at least more than a Snap-Back Bounce Play and do not want to be caught in a Bear Trap.  Type 3 Intermediate Term are itching to get back and have ants in their pants.

ants

I suggest it would be prudent to wait for one more week to decide whether we have a Santa Claus Rally or fall back into the doldrums, especially as the Election is next week.  Type 1 and 2 short-term traders will continue to enjoy the volatility on both the long and short side of the market.To help you make up your mind, I have developed a short-term perspective of where the market stands now that we have had two weeks to reflect on what has transpired since the big dive to almost a 50% drop from the Highs of Last November.  Let’s review the bidding of key events:

1. The Bail-Out Bill was passed on October 3rd. and the Stock Market crashed a week later

2. In the process we got a good feel for the Volatility which increased four fold from six months ago

3. It is not uncommon to see 600, 80 and 50 point swings/day on the DOW, the Nasdaq and S&P 500, respectively

4. As expected we had a snap-back in two days that produced over 23% for these Indexes

5. Then the market re-tested its Base Lows within two days, but basically held at that level

6. Helicopter Ben came flying in and propped the market up with a 1/2 point cut in the Rates

7. This has buoyed the market to hold the snap-back at the down-trend line half way back

8. The Critical Line in the Sand I offered is 9250 and the DOW is there abouts right now

9. From the following three charts, we are at a critical point on all three Indexes…Enjoy

dow 

nasdaq

sandp 

A couple of blogs ago, I gave you the key yarsticks to keep an eye on, and here it is again:

stats

Now there is both good news and bad news if you dig a bit deeper on the Internals of the Market.  Those who eagerly look for Breakouts from “Big Stocks” with good credentials have been disappointed so far, though things have been perking up with a few stocks showing signs of life.  It is no wonder when I show you the key internals that one looks for at times like these, which include the % of Industry Groups that have Di+ and D-  which is totally negative.  Likewise Industry Groups that are above 200-day and 50-dma are also putrid as is the Groups with either A or B Accumulation which again are the piths. A picture is worth a thousand words and that is clearly visible by the deep pink in these factors over the past 15 days or so:

internals

Now for the good news for those who wish to be the early bird that catches the worm.  I have told you time and time again to watch %B relative to the Bandwidth of the Bollinger Band Indicators.  %B is above and as you can see from the chart below, it is showing strong signs of life as it has already crossed the middle band to the upside.  If that relationship of the two Indicators which I have dubbed the Bulls-Eye can hold its positive status next week, we have the makings of at least a Bear Rally.

Bollinger

Those who attended the seminar last weekend understand all of this in spades, but I felt this would bring the rest of you up to speed on the essence of what they learnt to look for. 

Best Regards, Ian

How Should a “Newbie” Engage in this Volatile Market?

Thursday, October 30th, 2008

Mail-Bag Question from a Newbie:

Hi Ian:     I’ve become a regular visitor to your blog.  I don’t know much about investing.  However, I have a fair sum of money available in bonds and also some cash (+$200.000). Considering the current crisis, do you think that it is a good time for a novice like me to start investing in stocks…?  And what is your best advice to the newbies.  I’ve tried to follow the ups and downs of the stock market together with the commentary from the news pundits in the last couple of month.  The 22nd of September you wrote on this blog:“I’m not suggesting that we head down to 800 on the S&P 500 any time soon, but the odds of 1150 is now almost a certainty and again, if we see any signs of bickering in Congress we are headed for 1000 and possibly lower.” I’m asking since I’ve become a little wary of the risk involved with stocks.


Response:  Hi Matt:    
I apologize for the long delay in responding to your comment on my blog.  I got inundated with work at this end preparing for the seminar we just held and I am afraid your note got buried until now.

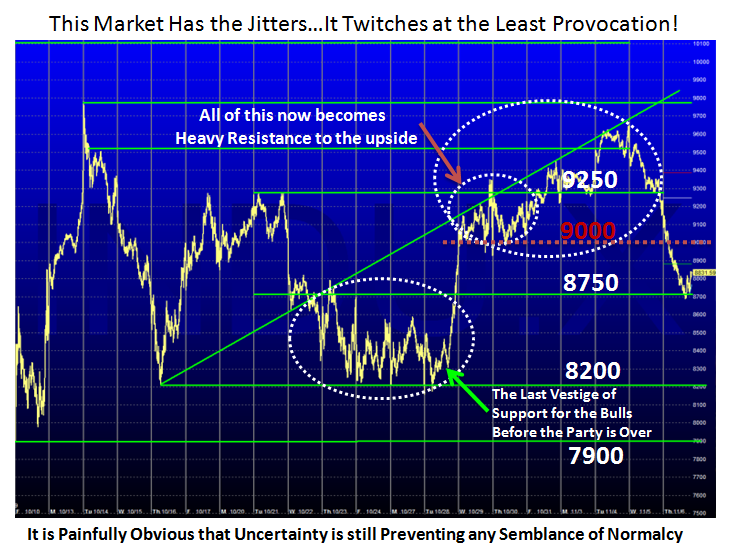
Thank you for being a regular visitor to the blog and I appreciate your concern about dipping your toe into the market with the high degree of VOLATILITY and UNCERTAINTY of the market direction.

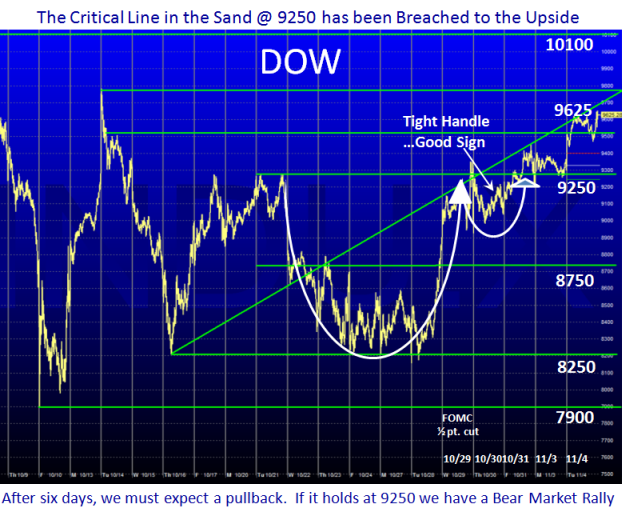
As you can see from the one piece you picked out from the blog note, nobody can predict how fast a Market can go down or up, but as you have seen by watching my blogs, I can give you the three scenarios for what I perceive are the current Up, Down or Sideways scenarios.  I also will show my leanings of the odds of any scenario, but it is the Market which tells me the direction.  Never, ever fall in love with one scenario.  However, having evaluated the three you will find that you will invariably be on the right side of the market or are ready to change course quickly if you have made a mistake.

Since you are a newbie to investing in stocks here are some pointers I would give you:

1.  The worst time for you to start was a year ago when the market was at a peak.  The best time to sharpen your pencil is NOW when the market has corrected so violently.

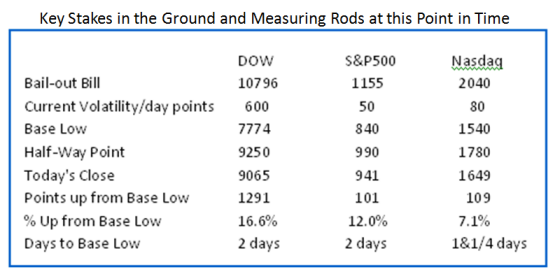
2.  The worst time for a Newbie to engage is when the Volatility is so high.  500 to 1000 point swings per day in the DOW are commonplace these days and that is 4 times more than it was six months ago.  Accomplished Day and Moment Traders are having a ball as they enjoy being jack-in-the-boxes hopping in and out of being long and being short.  That is no place for a newbie to start putting their hard earned money.

3.  One of the key reasons that one has seen such a change in volatility is due to the attraction of using leveraged ETF’s (Electronic Traded Funds) both long and short.  One can now trade them with twice the return if you wish to do so with these ETF’s being surrogates for the Market.  One can be in and out of the market quickly and yet have the comfort that you are buying a basket of stocks that emulate an Index such as the QID or QLD for the Nasdaq.  Ergo, Mutual Funds are a thing of the past.  Another reason for the volatility is the “No Up Tick Rule” for shorting stocks has been eliminated, so one can short at anytime rather than having to wait for the stock to “uptick” before you can purchase a short.  It goes without saying that a third reason is the flagrant over-indulgence in buying on “tick” on a world-wide basis where most can ill afford to do so, nor have the discipline to have proper money management.

4.  As a newbie, you MUST understand that over 50% of the gain/loss in a stock’s price is influenced by the Market.  A further 30% is due to the Industry Group the stock is in.  Only 20% is due to the stock itself.  With those odds and this volatility, it is fool-hardy at this point in time to think of long-term buy and hold unless you are prepared to possibly sit with dead money for a long time, unless you are a clever stock picker…which you are not since you declare you are both scared and a newbie.  Over the years, we have found that the trump card “retail investors” such as ourselves have is “Nimble”.

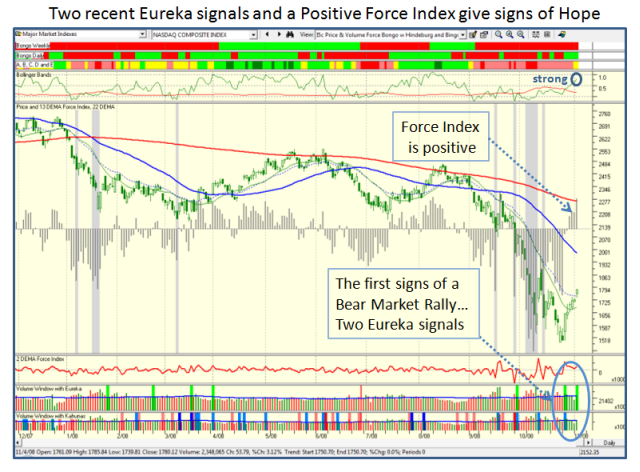
5.  That is why our approach to stock investing is what we call “Tops Down” starting first with an understanding of the Market behavior, then identifying the strongest Groups or Wolf-Packs as we call them, and then selecting the best stocks in those groups for a decent gain dependent on how the market is behaving.  If the wind is at your back, you attack…if it is a hurricane in your face, you will be blown over.  The trick is to understand what the Market and Industry Groups are telling you and this is the tremendous power of the HGSI software.

6.  To become accomplished as a Stock Investor/Trader, you must first be a master of one approach before you can blossom out into becoming a Jack of all Trades.  In other words, I find that one of the biggest mistakes Newbies make is to flitter around from one “guru” to another, and one talking head to another.   They are never around to tell you that they have changed direction while you are still holding the bag which is invariably dwindling, or they will always tell you “don’t sell now, it will come back” and it seldom does.

7.  However, NOW is the TIME for Newbies to get educated if not started into learning the Strategy, the Process, and the Implementation of how to make money in stocks.  Rome was not built in a day.  There is no dodging the fact that if you don’t first learn and paid some dues to study an approach, you will pay costly dues for learning from your mistakes.  That is why we have a three pronged approach to teaching Newbies like yourself how to get started:

a.  There is this Blog which you came across and find that my message is on point and useful.  Presumably, you like what you see.

b.  My partner, Ron Brown, does a WEEKLY FREE Stock Market Reports Movie every Saturday morning when he is not on holiday, that gives you his pulse of the market within 30 minutes of your time.  In addition by watching his approach you begin to pick up how to maneuver between the different elements of the HGSI software we use.

c.  We offer you a 60-day free trial of the High Growth Stock Investor software so that you can follow both Ron and I as we give you pointers of “What’s Working Now”.

Beyond that we continue to hold one’s hand by offering High Growth Stock Seminars twice a year (which as you can see are very successful) and a stock newsletter that comes out once a month on key relevant strategies and Case Studies of what to look for at that point in time.  We have also started a series of short Internet “Go To Meeting” courses to help trial members understand how to use the software.

The rest is up to you.  What you yourself put in is what you will get out.  It takes hard work.  Few of us can make a fortune without understanding and learning how to avoid the costly mistakes up front.  On the other hand, you will not start to increase your wealth to develop a nest-egg for your retirement unless you take the time to learn.  Ready, aim, aim, aim and never firing will never get you there.

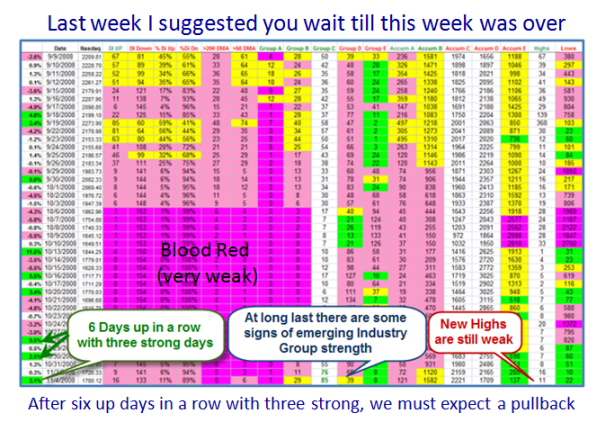
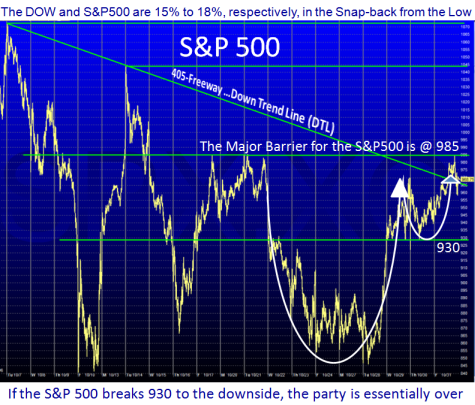
Two last points:  There is a wealth of information on the Learning Center on different topics Ron and I cover at the highgrowthstock.com web-site.  Also, I strongly suggest you go back to the blog and find the note I wrote on “Ignore the Fog and Follow the Signposts” written on Thursday, September 20th, 2007, and read that post and then STARE at the table (which is hard to read), and you will see that each of those milestones have come to pass as we have trundled down from the high of 1576 on the S&P500.  We had a PLAN and were able to ACT accordingly.

I’m sure there are other points I could cover.  If you have any questions, you have only to ask.

Best Regards, Ian.

Copyright © 2007-2010 Ian Woodward
Disclaimer: Commentaries on this Blog are not to be construed as recommendations to buy or sell the market and/or specific securites. The consumer of the information is responsible for their own investment decisions.