Ian Woodward's Investing Blog

Archive for the ‘Market Analysis’ Category

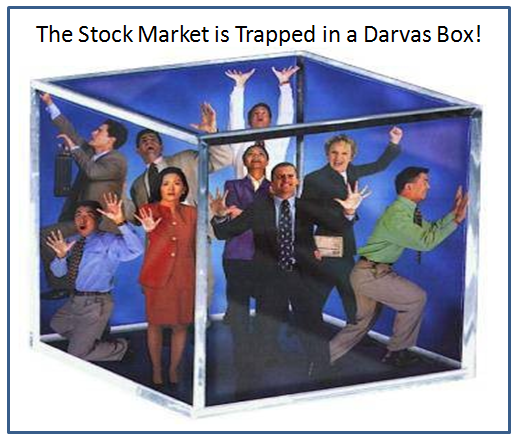
The Stock Market is Trapped in a Darvas Box!

Wednesday, June 24th, 2009

I found this picture that suits the current situation to a T, as we have been in a tight range for the past twenty plus days:

     box

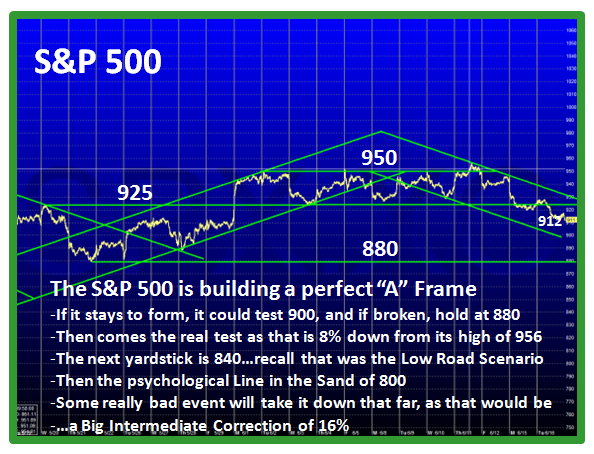
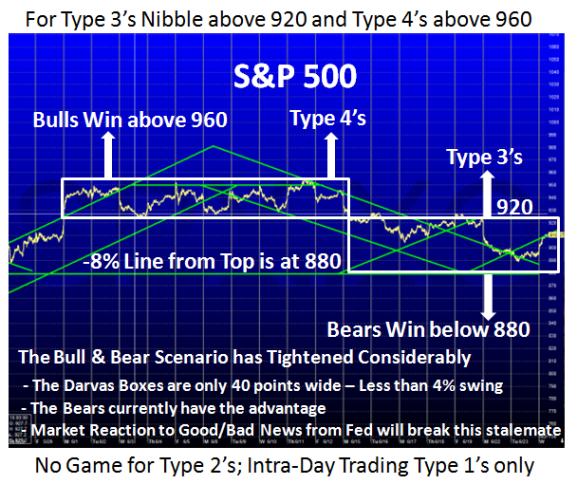
The Ballgame has changed substantially; I can’t recall a recent previous occasion when the market went sideways for ten days in a row and couldn’t put together more than two days up or down, and then spend another ten days in a similar box between 890 and 920ish as shown below.  As my notes indicate, this market is down to Intra-day Trading with the bias in favor of the Bears as the Market awaits news from the Fed Report:

s&p

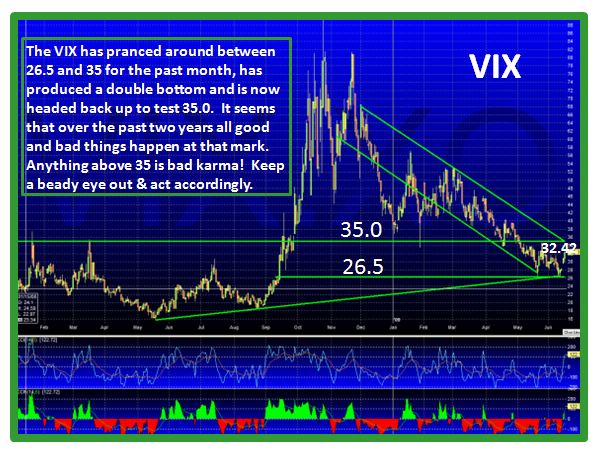
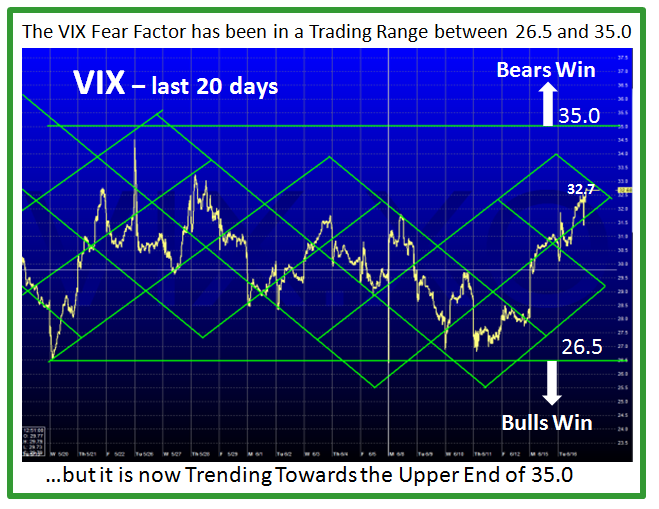
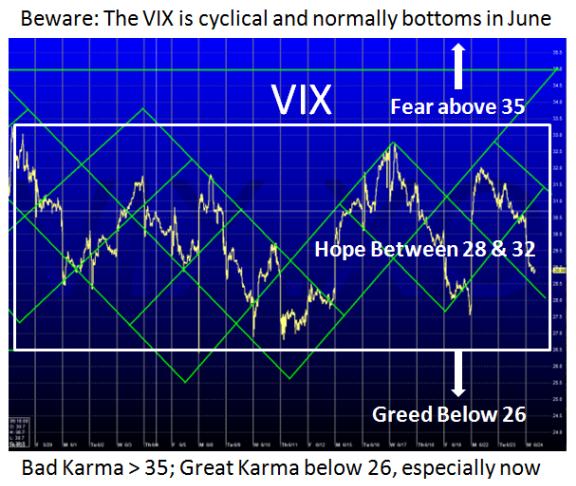
In sympathy with the S&P 500, the VIX has trapsed up and down in a similar Darvas
Box, where I show in the following chart that Bulls win below 26, bears above 35 and
we can only Hope for Relief between 28 to 32:

Many moons ago I came across Bill Luby’s blog “VIX and More” which I highly recommend to you as being THE expert on the subject of Volatility, and how to evaluate the VIX, etc.  One recent report that he has again covered is that the VIX is indeed Cyclical and shows you his research over 19 years for each month.  The bottom line is that the statistics show that the VIX invariably bottoms in the month of June and peaks in September.  He also suggested back in April this year that he did not expect the VIX to drop below the 25-27 area in the current bear rally.   Since we have reached that level, it does not bode well for the Bulls until we get past the summer doldrums or have a major surprise that drives the market to the upside in a hurry.  So please bear this cyclicality in mind going forward.

vix

On days like today when the Fed Report is due, most short term traders are cautious
and today was no exception.   The DJIA was up over 100 points at one point in the day having been up until the Fed Report came out.  It finished down 23 points at the close.

fed

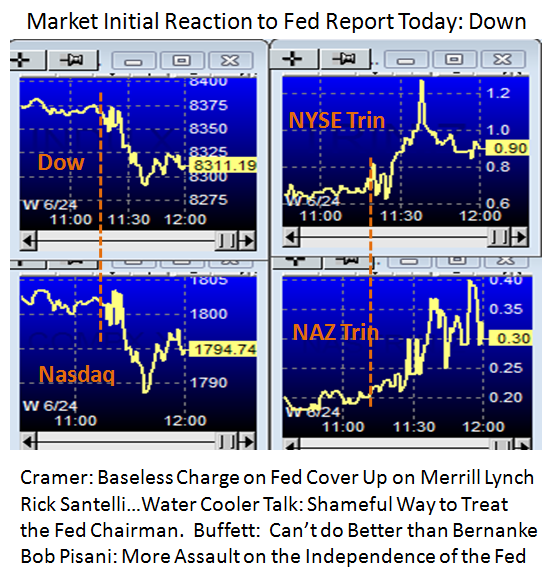
Let me make sure I do not mislead you as to the reaction to today’s Fed Report as at
around the same point in time an explosive accusation came from a California
Congressman  making a charge of a Fed Cover Up on the Merrill Lynch acquisition by
Bank of America.  For the record I show four snippets of comments on the bottom of
the above chart, and leave you to make up your own mind.  You be the judge what took the market down to finish in a trading range yet again.

Anyway, the bottom line was yet another ho-hum day and hopefully with the Fed
Chairman due to speak to Congress tomorrow, you can rest assured we have not heard the end of this accusation and rebuttal in which the Chairman denied.

The problem we still have is that this Market is so event driven based on news from the administration, the Treasury Secretary, the Fed and the Congress that we are treading on egg shells with every new day.

Best regards, Ian.

Stock Market Signposts with Stakes & Measuring Rods

Tuesday, June 16th, 2009

At this stage of a pullback in the Stock Market it is time to bring out the Stakes in the Ground and Measuring Rods to identify the Game Plan.  That way one is not surprised should it turn into a full blown correction, given the first signs of real weakness we have seen the last few days.

      pic

You have seen the Saw Tooth Game Plan many times, so it needs no introduction.  We have a 16% cushion, and 8% down will take us down to 880.  We are over half way there at 912, so it is time to sit up and plan ahead as to what action you will take if we fall further:

plan

The S&P 500 hit 956 at the high and decided that was enough for now and finished today at 912 so we are 4.6% down from the high.  Heading down to 880 would kill several birds with one stone:

a frame

1.  Drop <8% down where 77% of Minor Corrections are halted
2.  Start the next leg of this rally after a pause to refresh at that level
3.  Breakdown into an Intermediate Correction of 12% to 16%
4.  Test the areas of support at 840 which you will recall was the Low Road
5.  Head down further to test the psychological Line in the Sand at 800

Types 1 & 2 will quickly turn from being long to turning to the short side;Type 3’s will be patient and wait for sunnier climes; Type 4’s will review the extent of the damage and if the Golden Cross of the 50-dma up through the 200-dma materializes for the S&P 500, Dow and NYSE, they will scratch their heads as to whether it is then time for them to enter.  The Nasdaq and NDX (Nasdaq 100) should already be above whether it is measured with Simple or Exponential Moving Averages…whichever tickles your fancy.

Another way of assessing the extent of the potential damage is to turn to the Fear Factor of the VIX which has been relatively benign this past month.  However, after seemingly wanting to head down below 26.5 three days ago it turned turtle and has shot up to 32.7 as shown in the chart below:

vix 1 year

vix 20 days

Don’t stop there, but use a third approach to see if the underlying strength of the Leading Gorilla Stocks are holding up or giving up the ghost.  The last two days have been ugly, but that is the whole purpose of using these as a yardstick for early warning of good or bad things to come, since they are fat with profits.  My good friend Jerry Samet sent me his list of top stocks and I rounded it up to give us 25 in total…most of which I have shown you in recent blog notes.  Note half of them got walloped today, which should not be taken lightly.

leaders

chart

It’s always “Your Call”.  Best Regards, Ian.

Up, Up and Away with the Bears in Dismay!

Tuesday, June 9th, 2009

Since my last blog, I suggested that we might be “Up, Up and Away on a second leg of this rally”, and it looks as if that is in the making.

          Up

As Type 4 Buy and Hold Investors now fully know, they wait for a Golden Cross before they have some assurance that the Market has turned in their favor.  We have been keeping an eye on the 50-dma crossing up through the 200-dma, and although the S&P 500, DOW and NYSE are still working their way to that goal, the Nasdaq 100 and Nasdaq have done it.  That invariably bodes well for gathering momentum to the upside so it would be prudent to watch these two Indexes to see if they can make the next appropriate goals.  I left you with a clue as to which way the wind was blowing by giving you some 29 Leading Stocks that had paused to refresh.   That was three weeks ago and to make the point that bunch is up 12% as a group; so tuck that lesson away for the next time:

results

Before we get into next steps, you will also recall that I have left you with the Three Road Scenarios several times before now.  The one most familiar to you would be the 840, 940 and 1000 Scenarios for the S&P 500.   We are still wandering around the 940 level and are currently at 942.43, so 980 to 1000 is certainly within reach.  This time I will show you what to look for on the Nasdaq, if we are to move up a further leg before we see a reasonable correction:

1.  The High Jump comes into play at this stage
2.  The Gap up between 1905 and 1947 presents a nice opportunity to close it
3.  The Cushion to the support at the 50-dma or 200-dma is comforting at 10%

The higher it goes from here which is 1860.13, the better the cushion.  Likewise, we
have only another 45 points to go before we reach the gap, so keep an eye out for
that vacuum to be filled if we get to 1905.  That takes care of points “2” and “3”
above, so now we need to explore the High Jump. 

As you well know, the High Jump has  been a valuable tool when one gets extended
(overbought) or the reverse with the Limbo Bar for a Base Low (oversold).  We use the % of the 17, 50 and 200-dma from the Index added together to give us the High Jump.  Here is a trick I learned from one of my “students” many moons ago.  Her name is Michelle Anvary and she alerted me that it is useful sometimes to use the 17-dma and the 50-dma only rather than all three items.  This is particularly true when the sum of the 17-dma and 50-dma from the Index consistently reaches a similar level as shown in the chart.  It pays to look at the highest reading of the 17-dma and the 50-dma during this period.

Given that the result for the standard 17, 50 and 200 High Jump is already higher than any reading during the past year, we have to go back all the way to the breakout of 2003 to see similar numbers.  Instead of doing that (which I leave you to do as an exercise), we can zero in on the 17-dma and 50-dma combo to arrive at an estimate, as per below:

High Jump

On 3/23/2009 and  4/30/2009, the Hi Jump readings for the 17-dma & 50-dma are 11.69% and 15.55% at their peaks, respectively.  Applying those numbers to the current readings we get an estimate of:

a.  1.1169 x 1774.30 = 1982 for the 17-dma, or
b.  1.1555 x 1698.19 = 1962 for the 50-dma

So there you have it…three tests-of-reasonableness that suggest that this rally for the Nasdaq could have legs that can reach either 1947 (Close the Gap), 1962 or 1982 if it goes above 1905, which would be the normal resistance level. 

The Ratio of S&P 500 to Nasdaq = 942.43/1860.13 = 0.5066

Target      Nasdaq    S&P 500     % above Base Low (667)
Current      1860          942                     41.2%
Medium      1905          965                     44.7%�
High          1947          986                     47.8%
Higher       1962          994                     49.0%
Highest     1982         1004                     50.5%

The bottom line is that the original 840, 940 and 1000 Lines in the Sand were reasonable targets established months ago.  We can get turned back here at the middle road scenario in which case we have a 10% Cushion to Support at the 50 and 200-dma, or go on to strive for 1000 on the high road scenario.

Best Regards, Ian.

Wishful Thinking or the Next Leg of the Bear Market?

Monday, June 1st, 2009

Sure it is too early to say whether we are Up, Up and Away on a second leg of this rally.   With most Indexes having  vanguished the barrier of the 200-dma, and we should note with a Breakaway Gap, the Bears have been drummed into seclusion and the Bulls are already counting their chickens before they are hatched. 

The bulletin boards (bb) are abuzz with talk that the Coppock Monthly Indicator has turned the corner, and this is sweet music for the Type 4 Buy and Hold Investors who have waited patiently in the wings while they have missed all of a 41.5% move from the Base Low.  Is this the Manna from Heaven they have been waiting for?

picture

The HGSI Team has a strong contingent of supporters from the State of Texas and we are indebted to Maynard Burstein for his contributions in educating so many people down in that neck of the woods in San Antonio.   It is only fitting that I tip my hat to them as their favorite son, Edwin Coppock, who invented this little Indicator which is not known by most.   Except for “Quants” who have flooded the airwaves with a “Heads Up” today as more fuel for the fire of a new leg up, most would wonder what this is all about.   

Since the Coppock is probably not as well known, let me first give  you some background on its origin and then relate to the context in which I suggest it might be of value.

• The Coppock Curve was first published in Barron’s in 1962
•  Edwin Coppock was an economist from Texas
•  Coppock was asked by the Episcopal Church to find long tern opportunities
•  He saw Bear Markets as “bereavements” requiring mourning before recovery
•  He based the Coppock Signal on the time people need to recover, 11 to 14 Mos.
•  The Monthly Coppock is a laggard indicator, but is generally reliable
•  The more negative the Coppock Indicator, the longer and stronger the bull
     market that follows it when it finally turns up.
•  It is far more reliable at signalling Bottoms in the Market than Tops
•  It is currently at the second lowest reading in 88 Years of History per below:

     1921 to 2009

So why do we have all this excitement all of a sudden?  Another good friend, Dave Steckler, gave us an excerpt from another bb which summarizes the value of this Indicator by a contributor to that bb:

“I found that going back to 1928, there were 23 times when the Curve went below zero and hit at least a one-year low, then ticked up (this month’s reading was higher than last month’s).  One year later, the S&P was positive 17 times (74% win rate) with an average return of +13.7%.  I think the suggested time frame is three years, so using that I got 20 winners (87% wins) with an average of +29.0%.  The average drawdown during those three-year trades was only -9.9% compared to an average max gain of +45.2%.”

Now let’s look at what the fuss is all about.  The following chart shows the reason:

     2001 to 2009

Note that it shows the first signs of the Monthly Coppock Indicator turning up.  However, a word of caution is that turning up is not enough, and one can be faked out in long term Buy and Hold Type 4’s entering too soon.  If my beady eyes have spied the problem I suggest we need to see WIDE Separation of  monthly postings to make sure to avoid a “Fakey”.  Note that in 2001 and 2002 the Coppock Signal turned up only to cause a “Fakey”, and not until 2003 did we get the wide separation of postings.

However, assurance is at the price of lost Market gain as we are already up 41% from the Base Low and if one needs complete assurance then it would seem it would take a few more months for that to happen.   That scenario would suggest it would pay to wait for the famous Golden Cross which I have covered several times in this blog of  the 50-dma crossing up through the 200-dma.  To each his/her own.

Now let’s look at the snapshot of Dec 1921 to July 1980 which shows that the signals
are far more reliable at the Bottoms than the tops as seen by the 1964 to 80 timeframe:

      1921 to 1980

And now let’s zero in on the best case of all when we look at what happened in 1932-33
as shown in the next two charts:

       1940

      1933

I’m sure you get my point about the “Fakey” by now.  Before I wrap this up, it is only fitting that I remind you of three possible scenarios a month ago in the May 3rd blog. I have favored Scenario #2, but until we see differently, we might just be on Scenario #3!

      three

Best Regards, Ian.

Beware of Irrational Exuberance of Green Shoots

Saturday, May 30th, 2009

There comes a time when the Stock Market will confound you and do the exact
opposite of what most feel it should do.  For the last few blog notes I have been
cautioning you as to whether this market was in a “Pause to Refresh or a Correction”.
Also with my analogy to a London Pea-Souper  and Coming out of the Fog, I feel I
have given you enough warning to be on your toes for either a knee-jerk downwards
or a new birth to get past the obvious resistance at the 200-dma on all Indexes.

picture

I couldn’t help but give you one more warning where the latest buzz words around the Blogs and News Media are “Green Shoots”.  That pair of words was resurrected from 1991, when the then chancellor of the exchequer Norman Lamont was criticised for saying, during the middle of a recession, that he detected “the green shoots of economic spring”.   It goes without saying that those words haunted him to eventually step down.   I was reminded of another saying of “Irrational Exuberance” which I have frequently used, so take your pick, as I now couple the two together with those who said it.  Enough of that but I have always reminded you to have an Up, Down and Sideways Plan and let the market tell you which way the wind is blowing.  Sometimes the Calendar rules the roost, as it did on Friday when it turned turtle from a 20 point loss to a 100 point gain on the Dow inside the last 1/2 hour…if that.  The reason is the end of the month window dressing.  So we wait another week to really see which way the wind is blowing.

I feel the three pointers I recently gave you of the XLF banking ETF, the 40 Week Bollinger Band around the S&P 500 Index and the list of stocks which were first round winners that were pausing to refresh give you the focus of what to watch.  Every single one of them are perking up again and beauty is in the eye of the beholder:

1.  The technicians will point to myriads of Market Indexes and ETF’s that are at the 200-dma for what would seem key resistance and in a sentence “They either break through with authority or fall back from a Double Top.” 

2.  Others will suggest that the Leading Stocks have now all set up respectable Bases, above both the 50- and 200-dma, and more beautiful set ups you could not wish for with Cups and Handles, Flat Bases, and High Tight Flags coming out of their ears.

3.  Yet again, others will suggest that this rally is long in the tooth and is producing a rounded top especially as the S&P 500 has done little but go sideways, albiet in a tight pattern, since it hit a high of 930.  This is only a matter of ten points from where every technician had pointed to as a point to watch for a peak. 

4.  Ask the Type 1 and 2 Short term traders how they are fairing and they will all say “Tricky Market, and you better be nimble within Intra-day moments to cope with the wild gyrations”.

5.  Type 3’s who comprise three groups of swing traders are either:

a.  Out of the Market and kicking themselves for having missed a decent Bear Market Rally
b.  In the Market and trying to garner the profits they have lest they slip away
c.  Already playing their cards as if they were budding short-term Types 1 and 2

6.  If you belong to bulletin boards which most of you do, you can see there is little enthusiasm since most are waiting for a correction of some sorts before they engage in the next leg up.

7.  Long Term Type 4 Buy and Hold Investors are patiently waiting in the wings for better signs of a true improvement in the economy and the usual Fundamentals that show that the S&P 500 can prop up the Price given the dismal Earnings it now has.  They also know that the long term test from a technical standpoint is to be patient and wait for a “Golden Cross” of the 50-dma coming up through the 200-dma, which by my estimate will be around the fall of this year as I have shown you many times before, unless we have a further disaster.

So I come full circle to the Theme of this blog note which is to beware of politicians propping up this market with platitudes and precious little substance other than hope.  To round off the tidbit I gave you earlier, the ex-chancellor – now Lord Lamont – said there was always “huge pressure” on ministers to talk up the economy.   But he warned that ministers risked getting into “very dangerous territory” if they strayed too far ahead of events in the real economy. “The recession now has only just begun and recovery is very unlikely before the end of 2009,” he told the BBC back in January after chiding the Business minister Baroness Vadera had denied she is out of touch after claiming she could see “a few green shoots” of economic recovery.

Lastly, let me leave you with a Summary Comparison of the S&P 500 from 1929-42 and Now, with the latter the best up and down since the peak in 2007.  Except for the maximum, this Best Up and Worst Down have beaten the Average and Median of that era.

                    stats

Best Regards, Ian.

Copyright © 2007-2010 Ian Woodward
Disclaimer: Commentaries on this Blog are not to be construed as recommendations to buy or sell the market and/or specific securites. The consumer of the information is responsible for their own investment decisions.