Ian Woodward's Investing Blog

Archive for June, 2008

A Smorgasbord of Good Stuff to Watch

Sunday, June 29th, 2008

You are either tired of this tricky Market and have already capitulated or you are all prepped for a Bounce Play.  It goes without saying that we are back to the critical Line in the Sand:  Do we hold the line at 1257 on the S&P500 or do we head down for the 1150 Target I have offered several times before on this blog and in the March Seminar Targets?  It is Nail-Biting Time and the question is “So you think you can dance” in this Difficult Market?

nail

  1. If you are an ardent follower of this blog, then I have provided you a Smorgasbord of items to watch this next week based on what I have taught you that are important in the Principles of HGS Investing. 

  2. With the HGSI Software we provide the investor the ability to practice several styles from Bottom Fishing to Momentum, from Trading in Moments to being patient, prudent and pouncing when the time is right. 

  3. We define opportunities that have MOMENTUM in Strong Fundamentals as its first and most important ingredient coupled with strong Price Gains in tune with the Market Direction.  Our approach is based on providing alternative scenarios that draw Lines in the Sand. 

  • We have had two Bingo Signals on the NYSE which suggests A Bottom…not necessarily the Bottom. 
  • All Indexes have Bongo Signals “No”.
  • We now wait for a Eureka within the next 12 days.  

I trust that the following snapshots from the past will give you what is important to look for at this critical juncture…I will let them speak for themselves, but it is always “Your Call.”  For those who attended the March Seminar, I strongly recommend you dust off the HGS 701 PowerPoint presentation.

s&p price  targets tkc Best Regards, Ian.

The FOMC did Something for Nobody!

Wednesday, June 25th, 2008

William Gross at PIMCO suggests the Fed is at Neutral, will not raise rates by December, the economy is de-leveraged and this is a period of slack.


magoo

 As widely anticipated, the U.S. central bank stands pat on interest rates.  But the inflation-hawk contingency appears to be gaining adherents, with policy statement admitting the risk posed by inflation has risen. MARKET SNAPSHOT:  REACTIONS TO THE FED
• Stocks retain gains after Fed Announcement then peter out
• Dollar retreats modestly
• Treasury market extends losses
• Crude oil pares some losses
• Gold rises as Fed’s steady
• Transportation – Shipping gets a bounce

fomc

Best Regards, Ian

Bank stocks in “capitulation”!

Friday, June 20th, 2008

Analysts at Merrill Lynch on Friday said investors appear to be capitulating with regards to bank stocks, frustrated into selling them down to levels below their real values as the credit crisis continues to wreck balance sheets. The analysts also slashed their earnings outlooks for several large regional banks and said they will continue to boost loss reserves and cut dividends. From Reuters financial headlines today…

  • S&P may cut debt rating for Ford, GM, Chrysler
  • Ford cuts truck output as sales tumble
  • Merrill shares fall on rumors of profit warning
  • Market ends lower on banks, oil concerns
  • Analysts slash U.S. bank estimates more as credit worsens
  • Yahoo shares fall after reports of executive exodus
  • Winnebago tumbles; CEO warns on price war

We are now 5 weeks into this correction, with the DOW already -10% down from its recent rally high as shown in the chart below.  Wednesday could be a big catalyst day with Durable Goods Orders at 8:30am, Crude inventories at 10:30am, the FED announcement at 2:17pm (this is where the fun should begin…but in which direction?), and RIMM earnings after hours.  Before that, it should be a sleeper.  If the NASDAQ does not undercut early in the week, there

ss

So let’s turn our attention back to the theme of this note which is how might we know where the Line in the Sand is for two scenarios: 

  1. The Banking Index ETF, i.e, XLF holds support at the 2002 level of $18.52 or higher, finishes the capitulation and reverses to the upside.  This will also imply a capitulation to the Limbo Bar (Lowest High Jump) for XLF which is $18.66 and -35.4% down from the 200-dma. 
  2. We have a Major capitulation that borders on a crash in the Financial Markets and heads even lower to establish a New Limbo Bar Low of > -35.4% from the 200-dma. Why all this excitement in using the Banking Index as the focus for understanding the degree of severity for the possibilities of this correction?
  • Sub-prime problems have taken their toll on Financial stocks and the Banking Index. 
  • What many have not realized is that the Banking Index is a fraction away from making a 100% drop down to its 2002 support levels.
  • The July 25 calls of 297,929 to puts of 62,653 provide a ratio of 4.8 which is a massive expectation to the upside on the XLF and Banking Index.
  • Daily Volume is once again showing signs of rapidly increasing with today’s volume at a staggering 188,753,200 shares and a dollar volume of $4.19 Billion
  • Lest we get too excited, I do not expect full capitulation until this number exceeds $7 Billion, and if you don’t believe me we exceeded this number on the previous Base Low when we hit $7.1 Billion on March 18, 2008, as shown in the following chart:

chartNote how there have been several attempts by the bottom fishers to find support only to capitulate and the Index head down again to find support, as it has trundled down to current low of $21.00 which it hit today:

2002 Note how the Dollar Volume has gone into oscillation in 2007-08, and that it has peaked several times above $6 Billion, so we should expect that at capitulation.  Now let’s look at the Limbo Bar picture:

limbo 

With all the financial turmoil along with the speculation in Oil no one knows where the Market will find a bottom, but at least you now have the guidelines and yardsticks to watch and measure and take action accordingly.

Best Regards, Ian.

The Hindenburgh Omen is back again – June 17th, 2008

Wednesday, June 18th, 2008

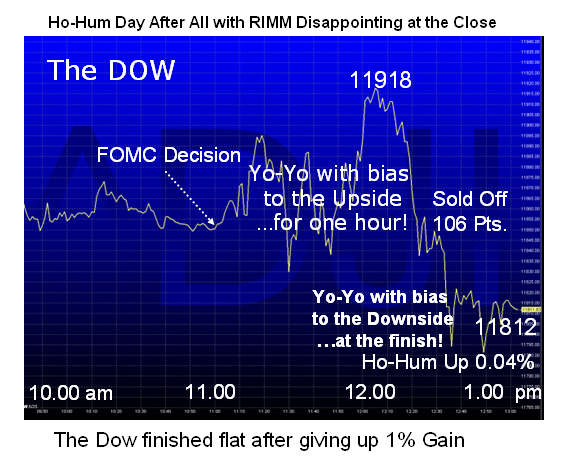
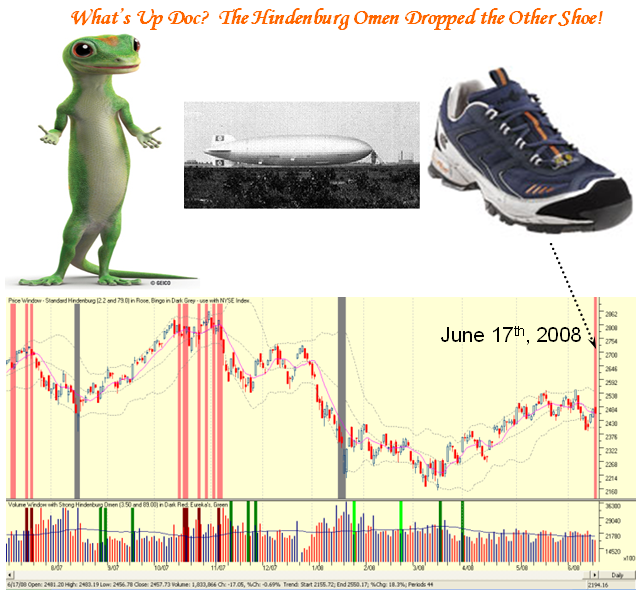
After a potential False Alarm a week ago last Friday which I covered by citing a Phantom Lone Ranger Hindenburg Omen, the “beast” is back again.  Yes, we got a firm signal this time as shown in the picture below, thanks to our proprietary indicators from the HGS Investor Software!

hindy


  1. Whether the previous one was true or false remains a mystery.  I did follow up as promised with a note to our Data Supplier, but as luck would have it the storms and floods in the mid-west took out the Servers, Electricity and all, so my note went into the ether.  Anyway, we certainly have a signal this time and as I can see by the flurry of people visiting my blog including my friends from overseas in Greece and Finland, the Europeans are certainly on their toes and concerned that the famous Hindenburg Omen (HO) has struck again and they know where to come for the Heads-Up!  Even Google seems to have my blog on their radar as I am in the Images Section if you take the trouble to type Hindenburg Omen and make sure you click on their Images Tab.

  2. This on top of the news from some of my friends in e-mails to me this morning that the:

  3. >>>The Royal Bank of Scotland has advised clients to brace for a full-fledged crash in global stock and credit markets over the next three months as inflation paralyses the major central banks. “A very nasty period is soon to be upon us – be prepared,” said Bob Janjuah, the bank’s credit strategist.  A report by the bank’s research team warns that the S&P 500 index of Wall Street equities is likely to fall by more than 300 points to around 1050 by September as “all the chickens come home to roost” from the excesses of the global boom, with contagion spreading across Europe and emerging markets.<<<

  4. The traditional definition of a Hindenburg Omen has five criteria:
  • That the daily number of NYSE new 52 Week Highs and the daily number of new 52 Week Lows must both be greater than 2.2 percent of total NYSE issues traded that day.
  • That the smaller of these numbers is greater than 79.
  • That the NYSE 10 Week moving average is rising.
  • That the McClellan Oscillator is negative on that same day.
  • That new 52 Week Highs cannot be more than twice the new 52 Week Lows (however it is fine for new 52 Week Lows to be more than double new 52 Week Highs). This condition is absolutely mandatory.

A confirmed Hindenburg Omen occurs if a second (or more) Hindenburg Omen signals occur during a 36-day period from the first signal.Now don’t panic, but forewarned is fore-armed.  Keep your powder dry and don’t be too complacent is the watchword.  Please understand that it takes a lot of factors to trigger the HO, but it seems the real sign is that the market is jittery right now and we may need a few more of these to really get us to take major defensive action.  In any event all HGS Investors are already playing this market close to the vest and the only ones sitting out are what I have called the Type 4, Long Term Buy and Hold Types, who continue to wait for the Short and Long Term Targets I have spelled out for you are traversed. By the looks of things it seems that will be a while longer.

Types 1, 2 and maybe 3 are having all sorts of fun on both sides of this market, but as usual “nimble” is the keyword to success.  Ron’s excellent Movie for the High Growth Stock Newsletter this past weekend showed you how to fish in the best Industry Groups, both on the upside and beaten down “downside”.  It goes without saying that the Energy Stocks are making hay for all of us, with the caution that one of these bright days that bubble will burst. The Coals are moving fast as are the Fertilizers, and don’t forget the Steels which have been a trifle sluggish but warming up to go again.  Add the beaten down Solars to the list with CSIQ, SOL and ESLR the hot stocks of the moment, all are tricky to play but who said it was easy in this market?

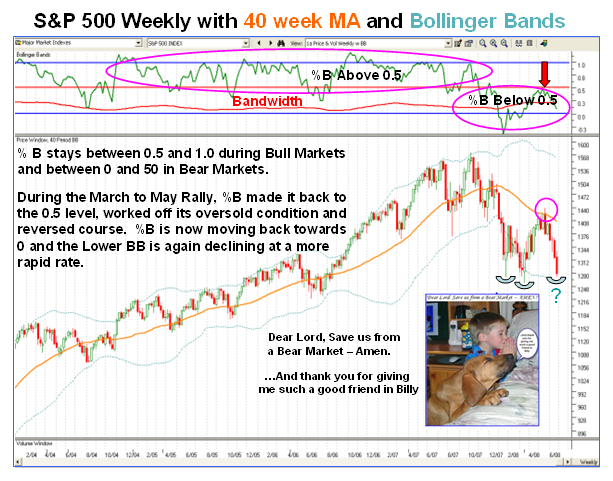
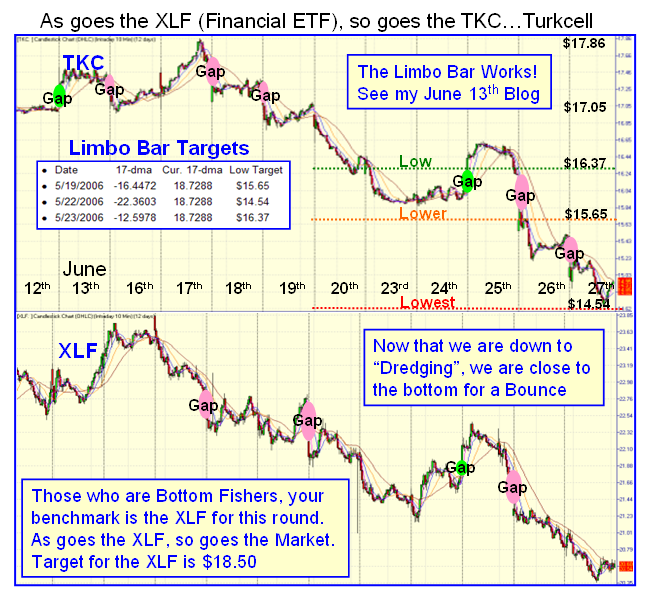
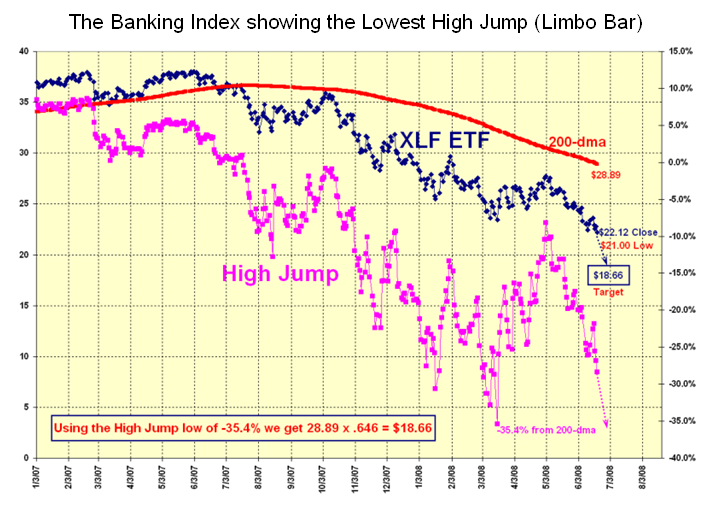
I am no bottom fisher but I say watch out as you have to be one with extreme patience and further more have your wits about you that you may end up having to dredge rather than bottom fish.  Just look at the example I covered on the Limbo Bar the other day with TKC, it would give me nightmares trying to catch the bottom on a stock like that unless you are extremely patient and wait and wait and wait.  Otherwise you will be caught knee deep in the mud.  It is trying to put in a bottom here with five days of sideways move, but Chaikin’s Money Flow says they are still selling.  It’s not difficult, and even “bottom fisher’s must be good timers and know how to play that game or else they become dredgers.”  I like the ring to that line and will keep it for our next seminar in October!

Best Regards, Ian.

Editor’s Note!  I recommend that you read the notes in the Comments section where I explain what it takes to trigger a Hinenburg Omen signal and that the recent near misses are a CAUTION that the reason for all of this is speculation on Oil coupled with the “herd is buying while the pros are selling”.

High Growth Stock June Newsletter Overview

Sunday, June 15th, 2008

      cartoon 

  • Happy Father’s Day to all and may today’s U.S. Open golf be as exciting as yesterday!
  • After a decent Bear Market Rally to the tune of 11% to 15% depending on the Market Index we have had a pullback with Big Foot popping out of the woods for a moment with an 8% correction on Thursday for the DOW and NYSE Indexes.  However, Friday’s snap back was a gift, but we have a lot of work to do to recover from that >400 point hammering a week ago.   Most Indexes are 5% to 7% from their recent high, so although we are by no means out of the woods, at this stage we are still within reach of the two critical lines in the sand preventing us from moving higher:
  1. The glass ceiling of getting past the 200-dma is uppermost on our minds.

  2. The 40-period Bollinger Band Chart must see the Indexes above the orange line of the middle BB.  That is the true test of whether all Indexes are fully on the mend. 

    indexes


    500

  •  I have been concerned for some time that the Follow Through Day (FTD) concept is very hit and miss, and with the help of a team of four others I am pleased to say that we have a very encouraging preliminary Case Study which should have pay dirt for us in the future.  It combines aspects of the usual factors with the proprietary ones from our own HGSI Indicators to give us a Market Meter of when to engage and when to avoid what is supposedly a follow through day!

  • Ron’s movie and focus this month is a continuation on Wolf Packs with Price momentum over the past month, i.e., Group Speed over 5, 10, 15 and 21 days.  In this month’s newsletter he provides some new warehouse views and combos to help keep you on top of what is happening in the market.  The warehouse views are assigned to the “I key”.

  • The next Seminar will be from October 25 to 27, 2008, and it is time to get cracking and sign up.  We already have 35 paid five months in advance of the seminar, and five others who are committed to attend so we are 66% full.  Hurry if you intend on coming as the interest is already very high.  Sign up on the website or send me a check for $1200.  First-come-first-served is the order of the day…there will not be any reserved seating.  A full house is 60 people and we are filling up fast.  Best Regards, Ian. 

Copyright © 2007-2010 Ian Woodward
Disclaimer: Commentaries on this Blog are not to be construed as recommendations to buy or sell the market and/or specific securites. The consumer of the information is responsible for their own investment decisions.